Fig. 7.
Download original image
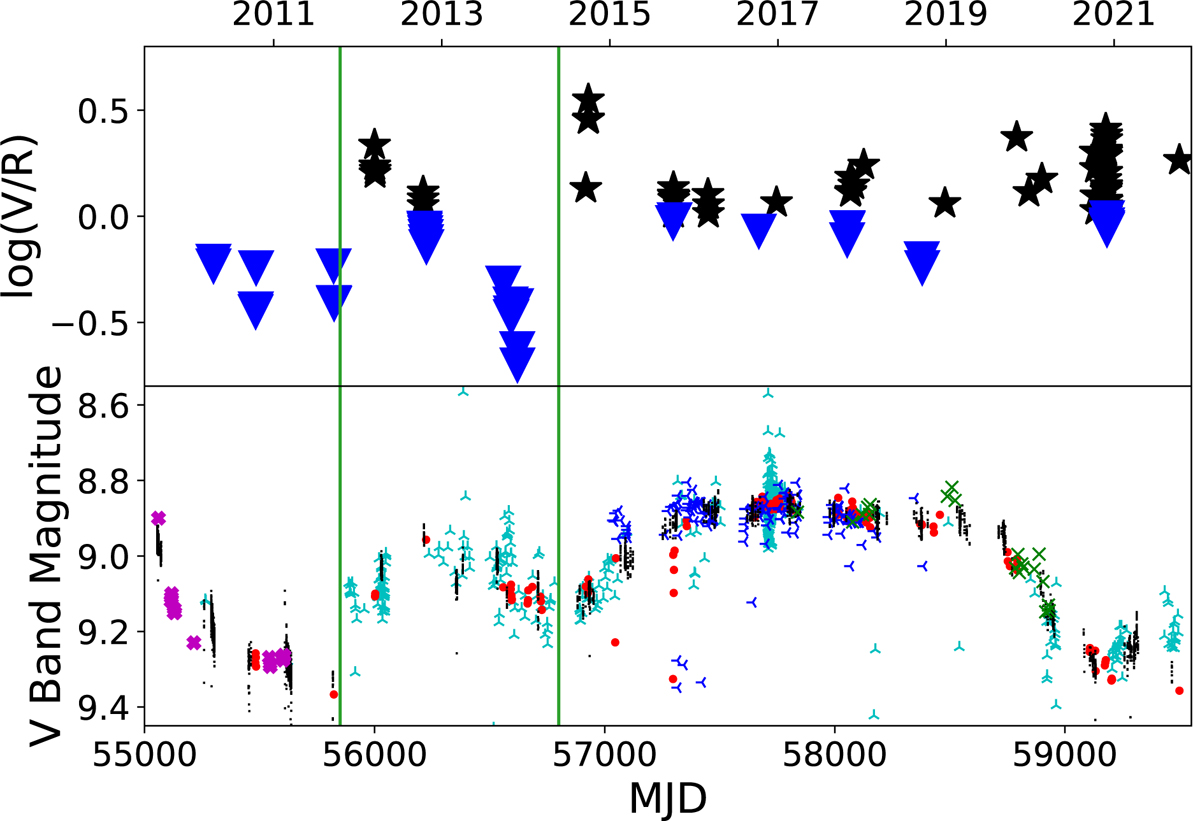
Long-term variations of 1A 0535+262 in log(V/R) and optical V band. Top panel: evolution of log(V/R). We use different symbols to represent the different profiles of spectral lines: stars represent the spectral profiles with V > R, triangles represent the spectral profiles with V < R. Bottom panel: long-term light curves of optical V band. We omit the legend for conciseness; it is the same as the fourth panel of Fig. 1. The vertical green lines mark the minimum brightness in the photometric V band at the V = R phase before the start of the V > R phase at ∼MJD 55850 and 56800, respectively.
Current usage metrics show cumulative count of Article Views (full-text article views including HTML views, PDF and ePub downloads, according to the available data) and Abstracts Views on Vision4Press platform.
Data correspond to usage on the plateform after 2015. The current usage metrics is available 48-96 hours after online publication and is updated daily on week days.
Initial download of the metrics may take a while.