Fig. A.1
Download original image
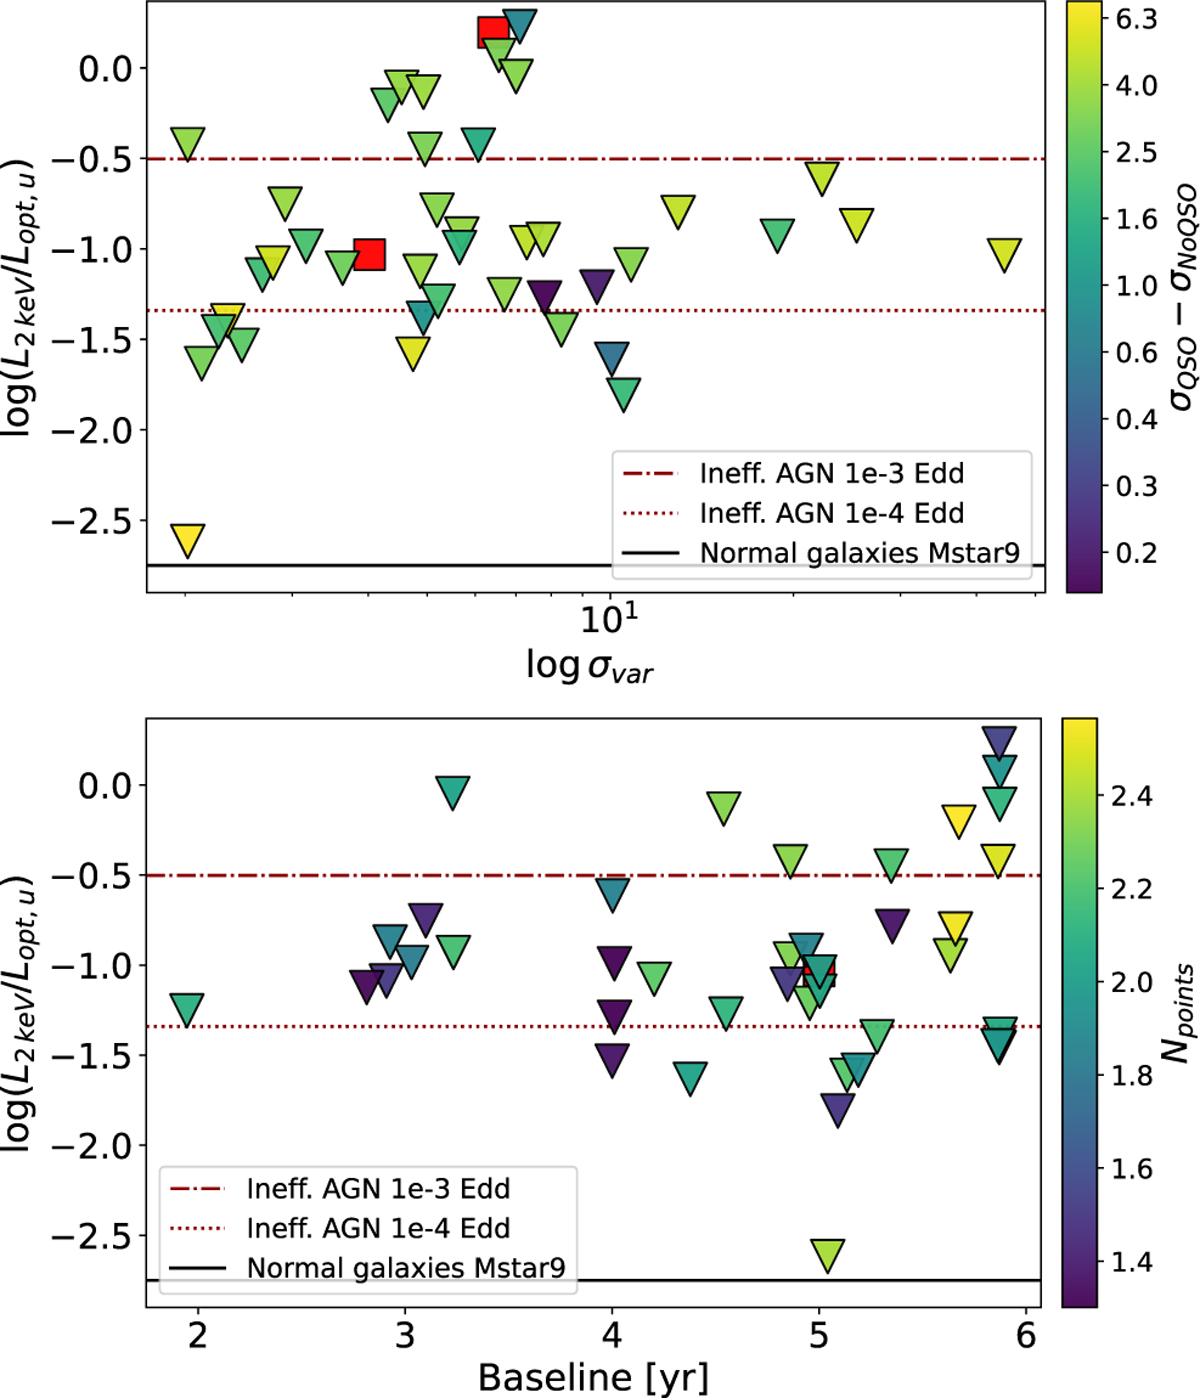
Top panel: observed X-ray to optical ratio as in Fig. 8, shown here as a function of optical variability significance and is color-coded as a function of the significance of AGN-like (compared to non-AGN-like) variability. Only non-X-ray-detected galaxies from Baldassare et al. (2018) and Baldassare et al. (2020) are color-coded. X-ray detections are shown with red squares. Bottom panel: same as the top panel, but as a function of baseline in years of the optical light curve, color-coded by the number of data points.
Current usage metrics show cumulative count of Article Views (full-text article views including HTML views, PDF and ePub downloads, according to the available data) and Abstracts Views on Vision4Press platform.
Data correspond to usage on the plateform after 2015. The current usage metrics is available 48-96 hours after online publication and is updated daily on week days.
Initial download of the metrics may take a while.