Fig. 8
Download original image
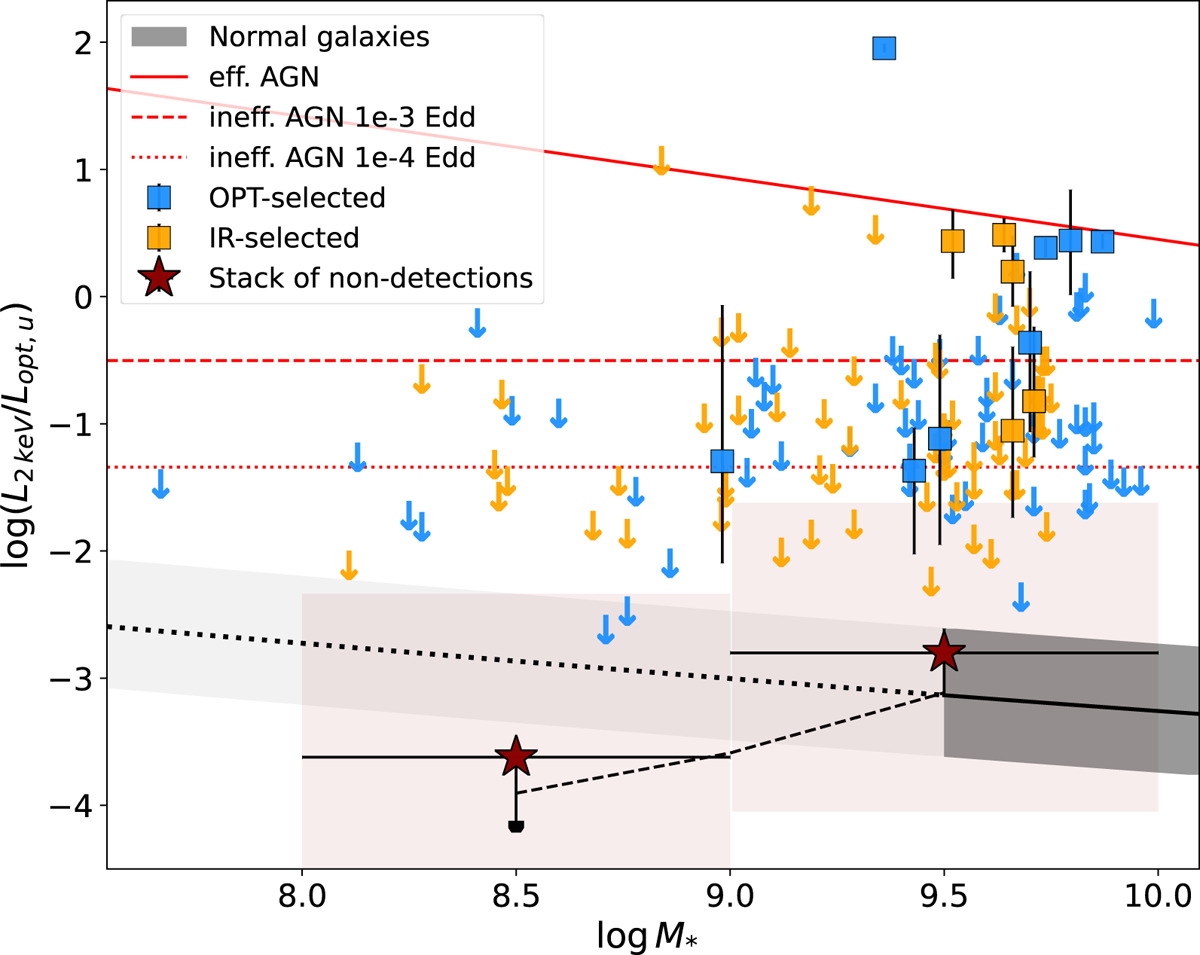
Observed X-ray to optical ratio as a function of galaxy stellar mass. Squares indicate X-ray detections and arrows 3a- upper limits, color-coded by the waveband used for variability selection. The luminosity from the stacked images of non-detected galaxies are shown with red stars (and their uncertainties with shaded contours, see the text in Sect. 6). The black contour indicate the predicted X/O from normal galaxies (Lehmer et al. 2019), the dotted black line its extrapolation and the dashed black line a tentative correction for the low-mass end (Gilfanov et al. 2004; Lehmer et al. 2019, and refer to Sect. 4.2 in this work). Red lines show the predicted X/O for AGN in their radiatively efficient phase (solid red line; Arcodia et al. 2019), compared to inefficient ones at ~10−3 or ~10−4 Ledd (dashed and dotted red lines; Merloni 2016; Ruan et al. 2019).
Current usage metrics show cumulative count of Article Views (full-text article views including HTML views, PDF and ePub downloads, according to the available data) and Abstracts Views on Vision4Press platform.
Data correspond to usage on the plateform after 2015. The current usage metrics is available 48-96 hours after online publication and is updated daily on week days.
Initial download of the metrics may take a while.