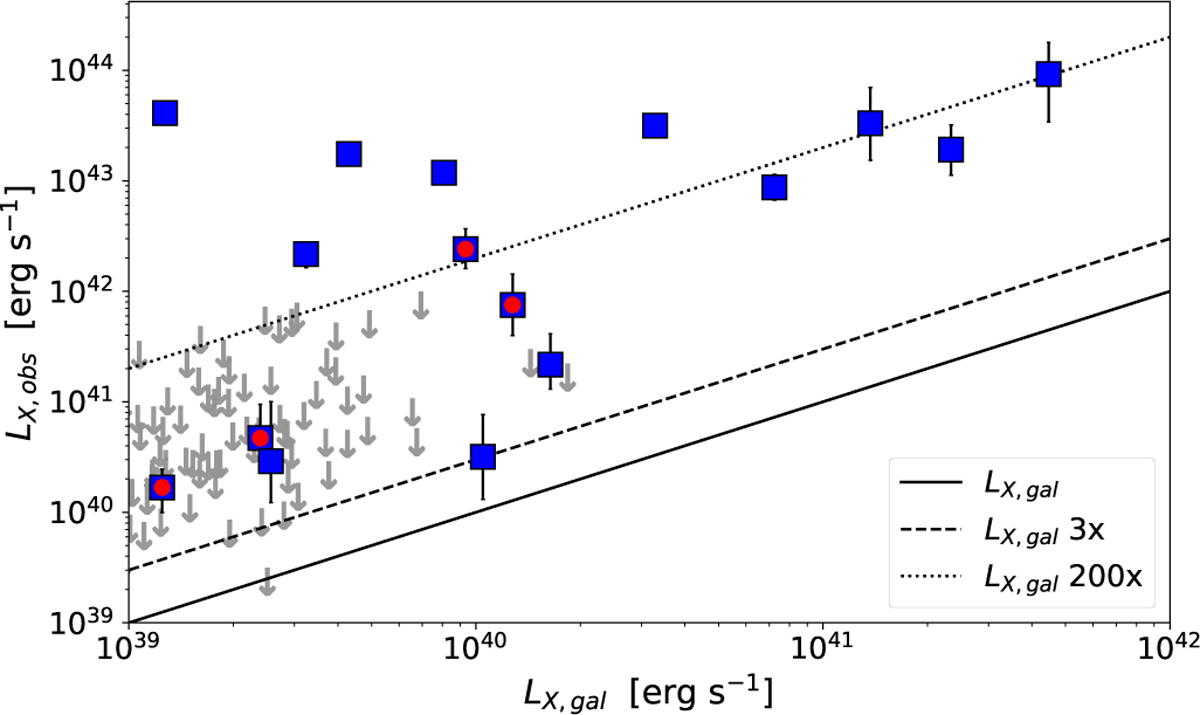
Fig. 6
Download original image
Predicted LX,gal (Lehmer et al. 2019) versus the observed X-ray luminosity of our eRASS:4 detected sources, both in the 2−10keV range. The 1:1 relation is shown with a black solid line, while the dashed and dotted lines show the predictions increased by a factor 3 and 200, respectively. Markers containing a red circle represent new X-ray sources (see Sect. 5.3). The subset of X-ray non-detected galaxies in the same range of the detected ones are shown with gray arrows, for reference.
Current usage metrics show cumulative count of Article Views (full-text article views including HTML views, PDF and ePub downloads, according to the available data) and Abstracts Views on Vision4Press platform.
Data correspond to usage on the plateform after 2015. The current usage metrics is available 48-96 hours after online publication and is updated daily on week days.
Initial download of the metrics may take a while.