Fig. 5
Download original image
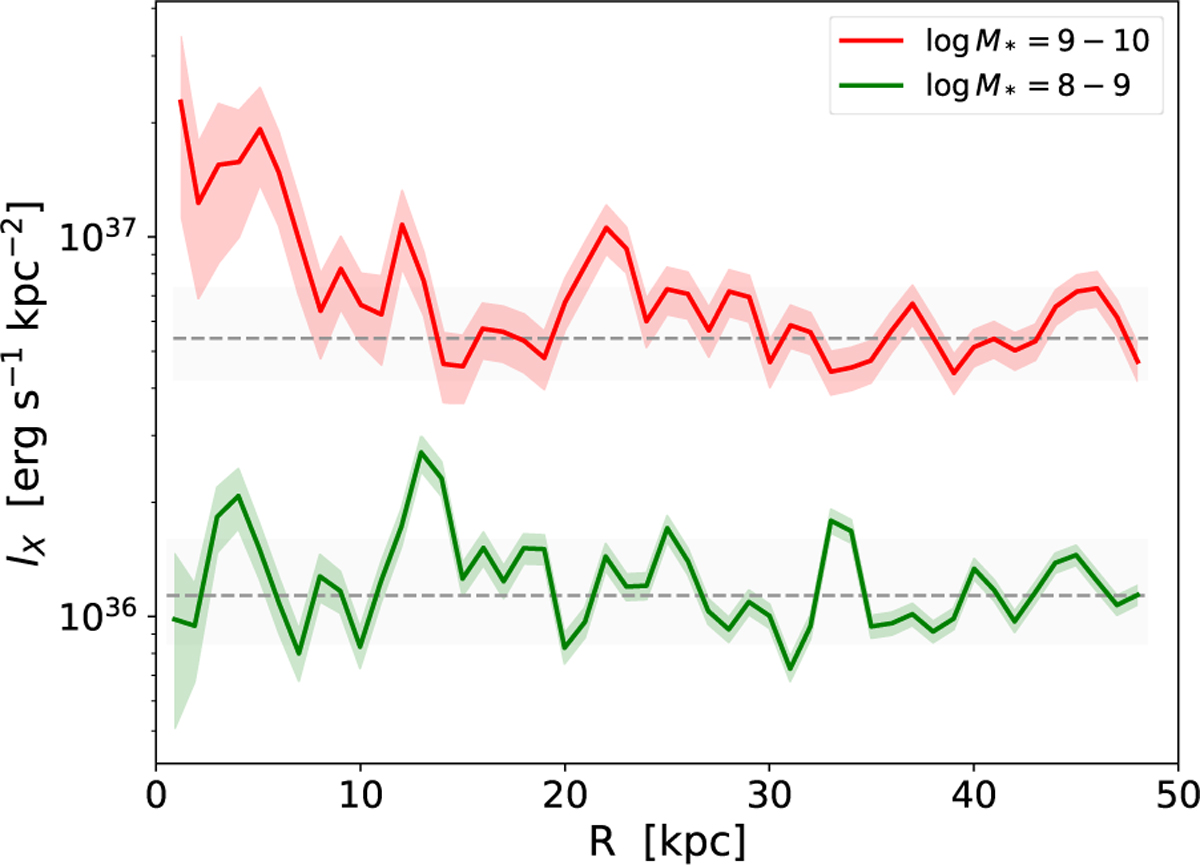
Emission profiles from the stacked images in two M* bins, log M* = 8−9 (green) and log M* = 9−10 (red). The source signal is integrated up to 10kpc, whilst the background is estimated from the median (or, the 84th percentile value, conservatively) of the emission between 15 and 50kpc (see Sect. 3). The stack contains signal above background only in the log M* = 9−10 bin.
Current usage metrics show cumulative count of Article Views (full-text article views including HTML views, PDF and ePub downloads, according to the available data) and Abstracts Views on Vision4Press platform.
Data correspond to usage on the plateform after 2015. The current usage metrics is available 48-96 hours after online publication and is updated daily on week days.
Initial download of the metrics may take a while.