Fig. 4
Download original image
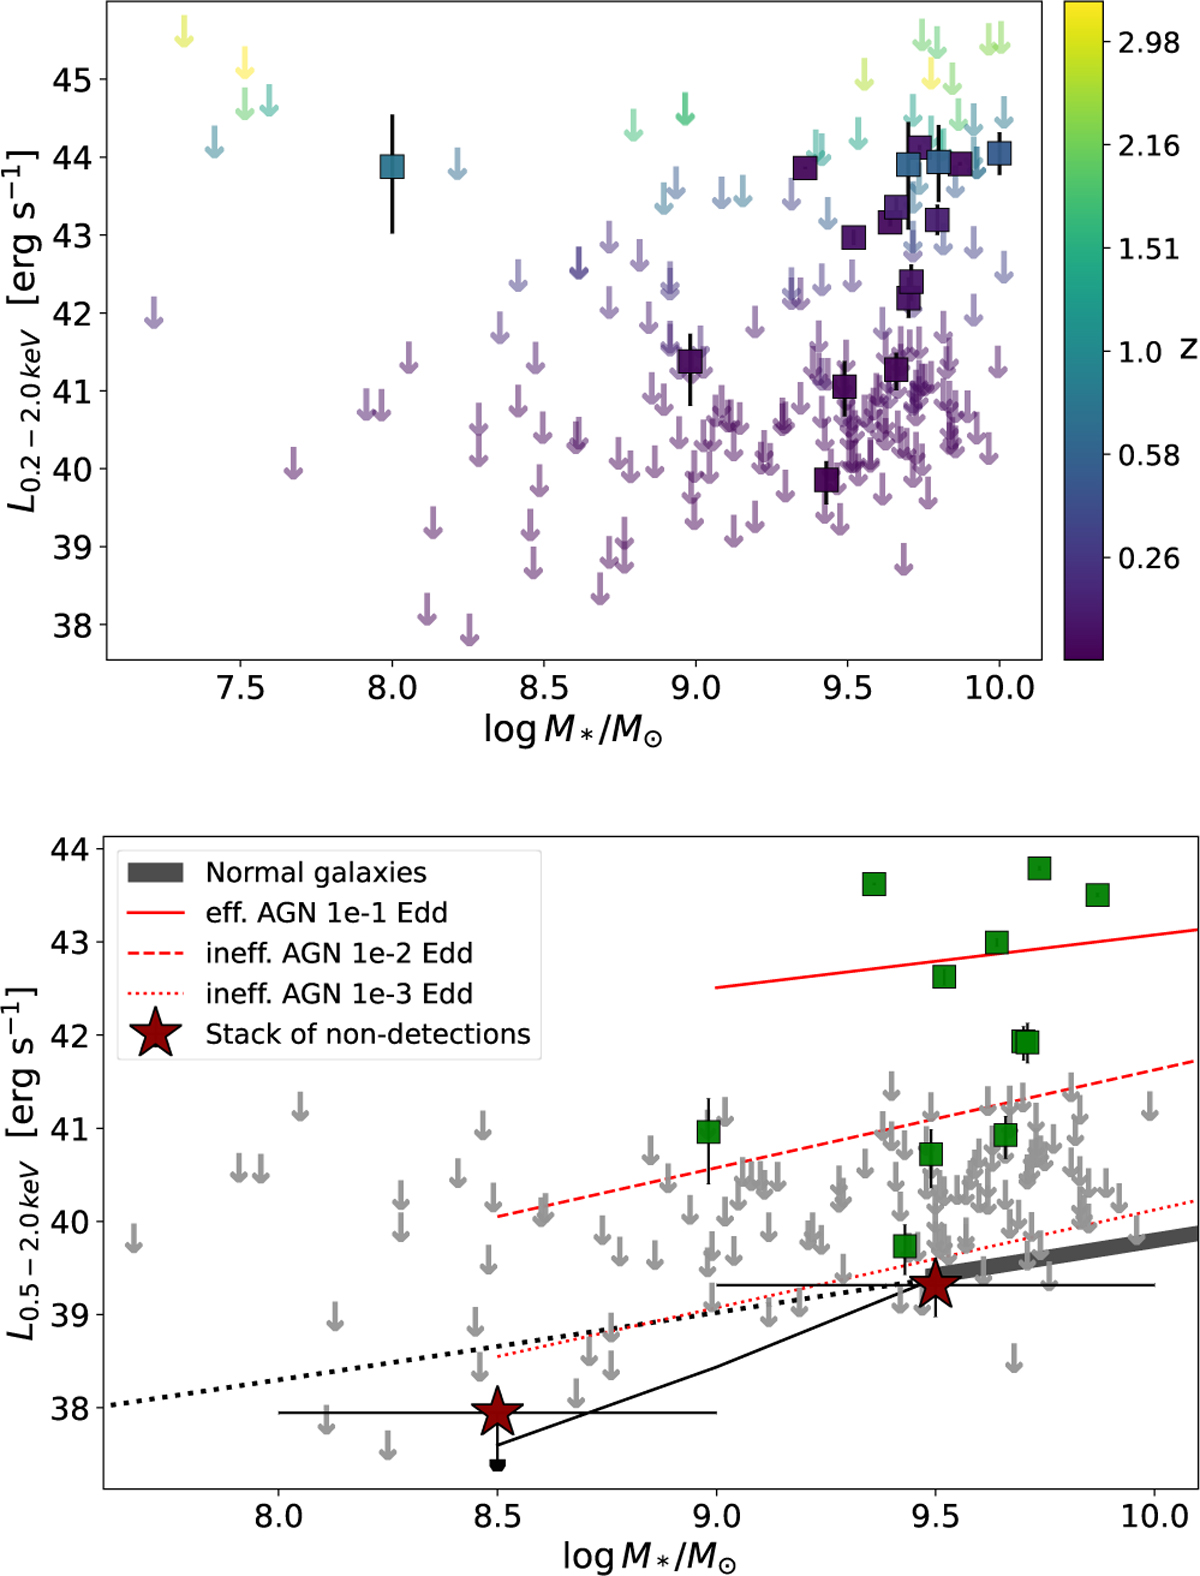
X-ray luminosity from eRASS:4 as a function of host galaxy stellar mass. In both panels, detected MBHs are shown with squares, whilst non-detected ones with arrows. In the top panel, all the sources are shown and are color-coded as a function of logarithmic redshift. In the bottom panel, only sources with z < 0.1 are shown: non detections (gray arrows) were stacked in two mass bins (highlighted by the x-axis error bars) and the related X-ray luminosity estimates are shown with red stars. We show the soft X-ray luminosity predicted for normal galaxies (black shaded contour and solid line) and AGN at different accretion states in the same stellar mass range (see Sect. 4.2 for details). In particular, predictions for radiatively-efficient AGN are shown with a solid red line, while predictions for AGN accreting at 1e-3 (1e-4) of L/Ledd are shown with a dashed (dotted) line.
Current usage metrics show cumulative count of Article Views (full-text article views including HTML views, PDF and ePub downloads, according to the available data) and Abstracts Views on Vision4Press platform.
Data correspond to usage on the plateform after 2015. The current usage metrics is available 48-96 hours after online publication and is updated daily on week days.
Initial download of the metrics may take a while.