Fig. 3
Download original image
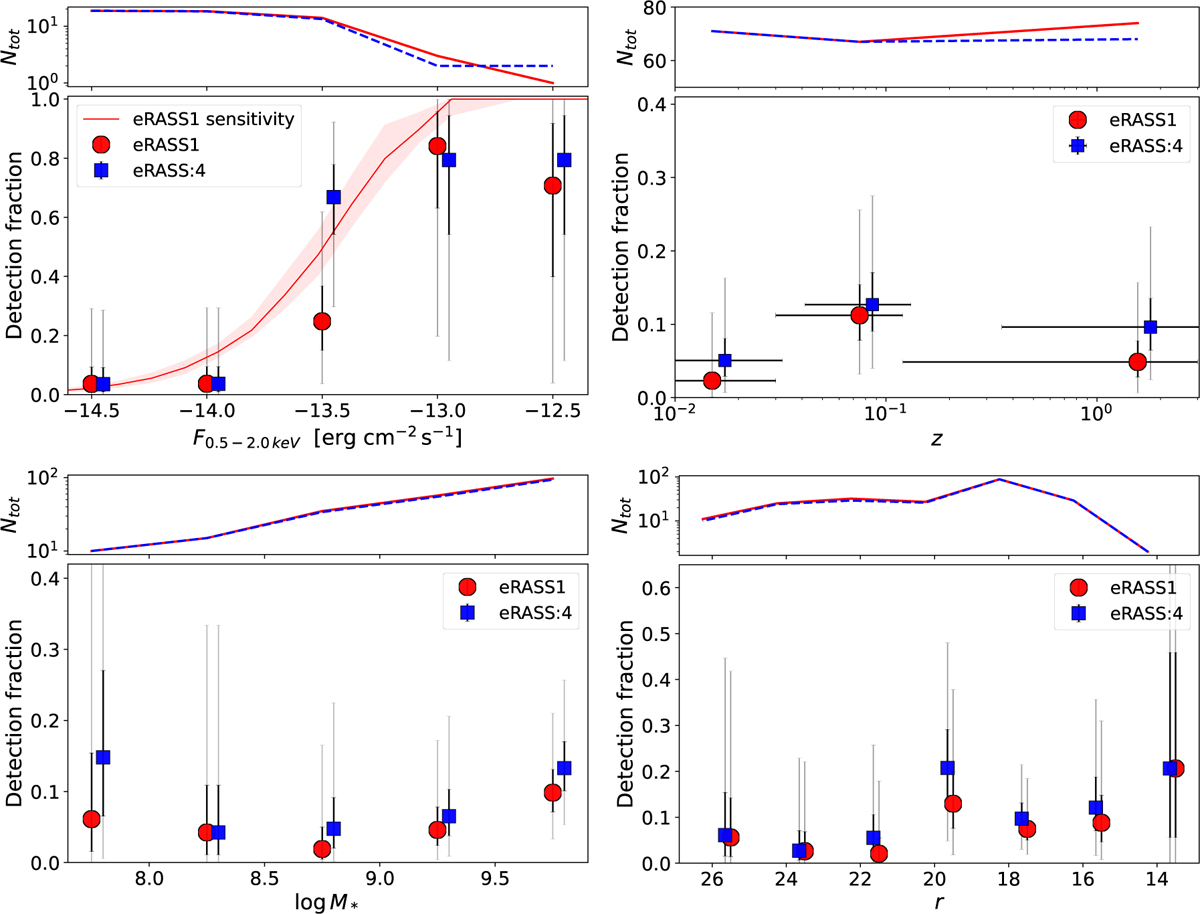
Fraction of input galaxies detected in eRASSl (red) and eRASS:4 (blue) as a function of X-ray flux (top left), redshift (top right), stellar mass (bottom left) and r-band magnitude (bottom right). Different symbols, between eRASS1 and eRASS:4, are slightly shifted horizontally for illustration purposes. In the top left panel, the red dotted line shows the eRASS1 sensitivity curve (Seppi et al. 2022). In all subplots, upper subpanels show the number of galaxies in each bin. 1σ (3σ) binomial confidence intervals (Cameron 2011) are shown in black (gray).
Current usage metrics show cumulative count of Article Views (full-text article views including HTML views, PDF and ePub downloads, according to the available data) and Abstracts Views on Vision4Press platform.
Data correspond to usage on the plateform after 2015. The current usage metrics is available 48-96 hours after online publication and is updated daily on week days.
Initial download of the metrics may take a while.