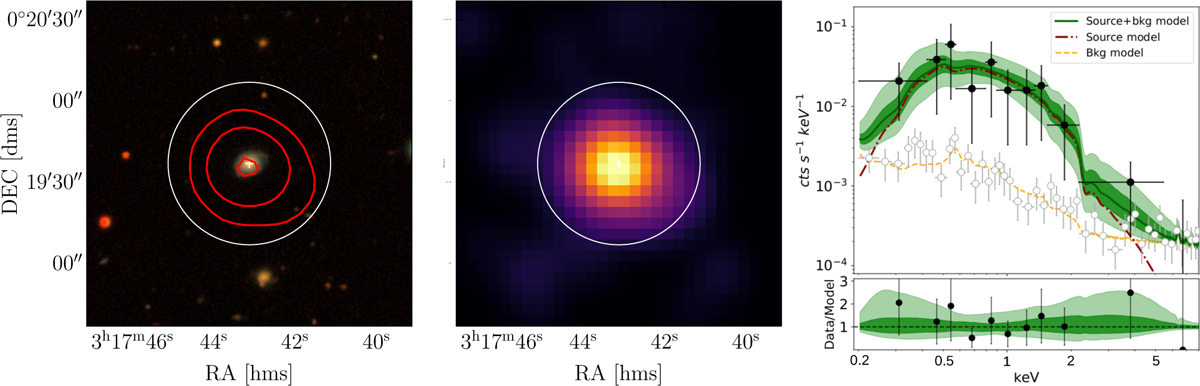
Fig. 2
Download original image
Example of X-ray-detected MBH candidate in SDSS J031743.12+001936.8 at RA, Dec = (49.4296, 0.3269) and ɀ = 0.069, taken from (Baldassare et al. 2018). Left: cutout of the DESI Legacy Imaging Surveys Data Release 10 (Legacy Surveys/D. Lang (Perimeter Institute)), centered at the input position. The white circle highlights the aperture of 30″ used for X-ray products. Contours of the X-ray source are overlayed in red. Center: eRASS:4 image centered at the input optical coordinates. Size and aperture circle correspond to those in the left panel. The positional accuracy of the X-ray centroid is 2″, from the POS_COR quantity (Merloni et al. 2024) of the eRASS:4 catalog. Right: X-ray spectrum of the X-ray source. Black points are source plus background data, empty gray points show the background alone. The power-law continuum model is shown by the dot-dashed red line, while the green line and related light green (dark green) shaded regions are the source plus background model median and 16th-84th (1st–99th) percentiles, respectively. The orange dashed lines shows the background model alone. In the lower panel, the data-model ratio is shown, following the format of the upper panel.
Current usage metrics show cumulative count of Article Views (full-text article views including HTML views, PDF and ePub downloads, according to the available data) and Abstracts Views on Vision4Press platform.
Data correspond to usage on the plateform after 2015. The current usage metrics is available 48-96 hours after online publication and is updated daily on week days.
Initial download of the metrics may take a while.