Fig. A.4
Download original image
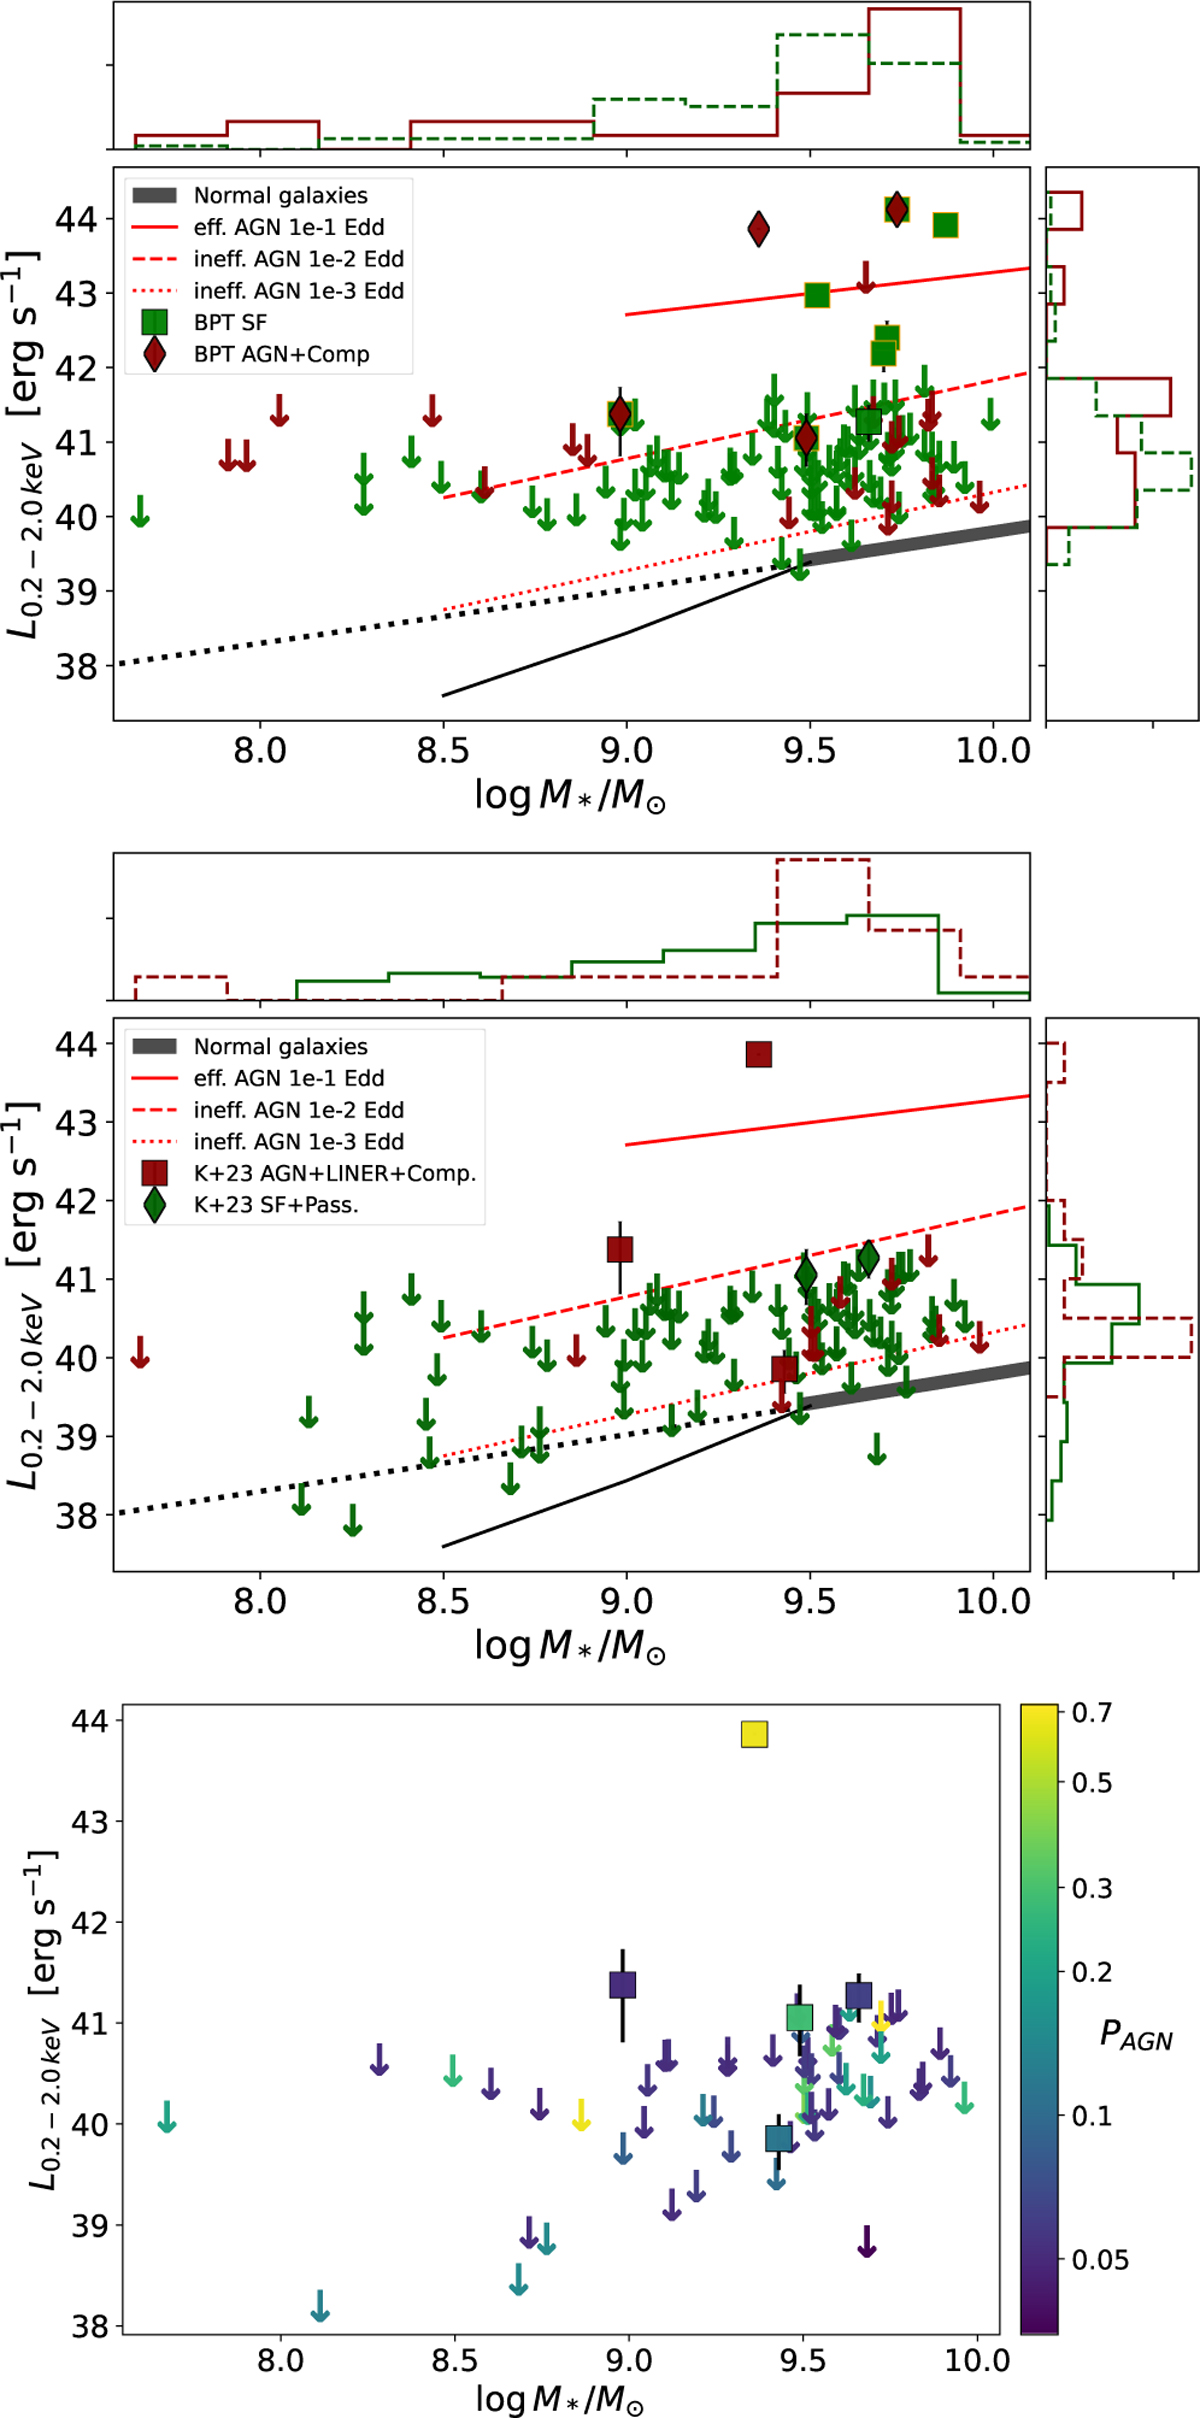
Top panel: same as the bottom panel of Fig. 4, but color-coded as a function of BPT classification (green for star-forming galaxies and red for "Composite" and AGN) from RCSEDv2 (see text). Orange contours around X-ray detection of star-forming galaxies highlight sources with a broad Ha component. Middle panel: same as the top panel, but using photometric and spectroscopic classifications from the HECATE catalog (see text). In this subplot, we also show LINERs together with AGN and "Composite" galaxies (red), and the passive together with star-forming ones (green). Bottom panel: same as the other panels, but galaxies are color-coded with a probabilistic estimate on the presence of an AGN, from photometric and spectroscopic classifications from the HECATE catalog (see text).
Current usage metrics show cumulative count of Article Views (full-text article views including HTML views, PDF and ePub downloads, according to the available data) and Abstracts Views on Vision4Press platform.
Data correspond to usage on the plateform after 2015. The current usage metrics is available 48-96 hours after online publication and is updated daily on week days.
Initial download of the metrics may take a while.