Open Access
Fig. A.2
Download original image
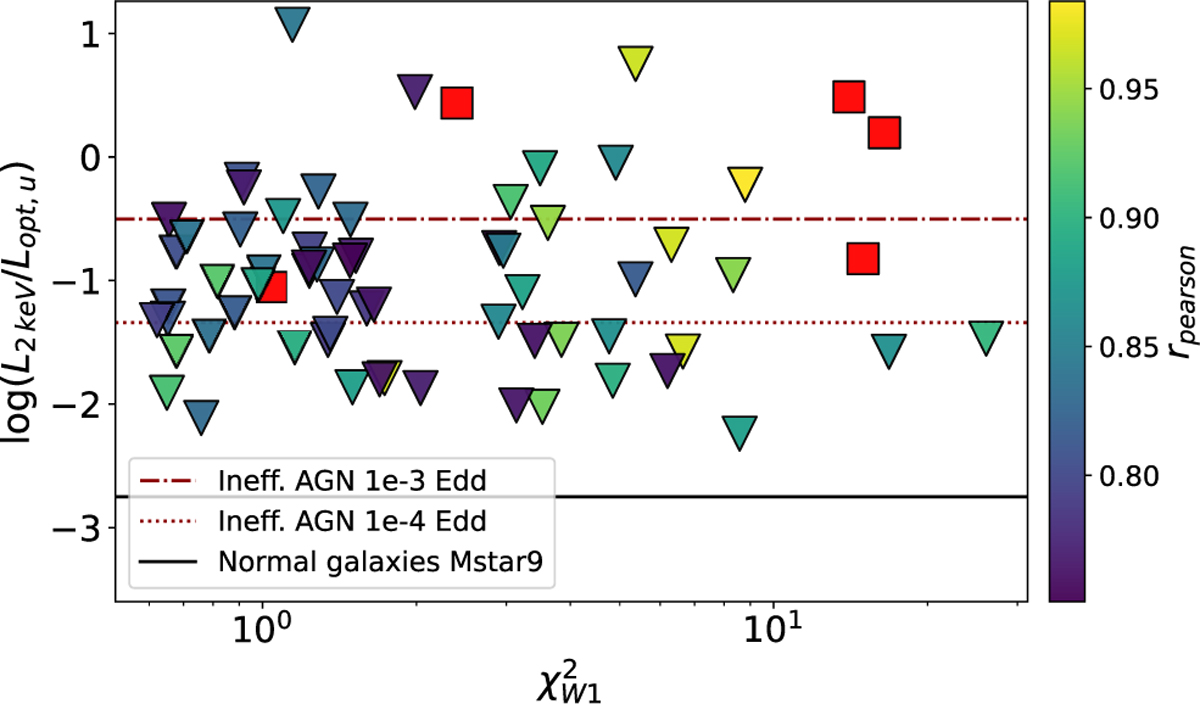
Same as Fig. A.1, but for the IR-selected galaxies from Ward et al. (2022). X/O values are plotted as a function of χ2 in the W1 band light curve and color-coded by the Pearson correlation coefficient between W1 and W2 light curves.
Current usage metrics show cumulative count of Article Views (full-text article views including HTML views, PDF and ePub downloads, according to the available data) and Abstracts Views on Vision4Press platform.
Data correspond to usage on the plateform after 2015. The current usage metrics is available 48-96 hours after online publication and is updated daily on week days.
Initial download of the metrics may take a while.