Fig. 1
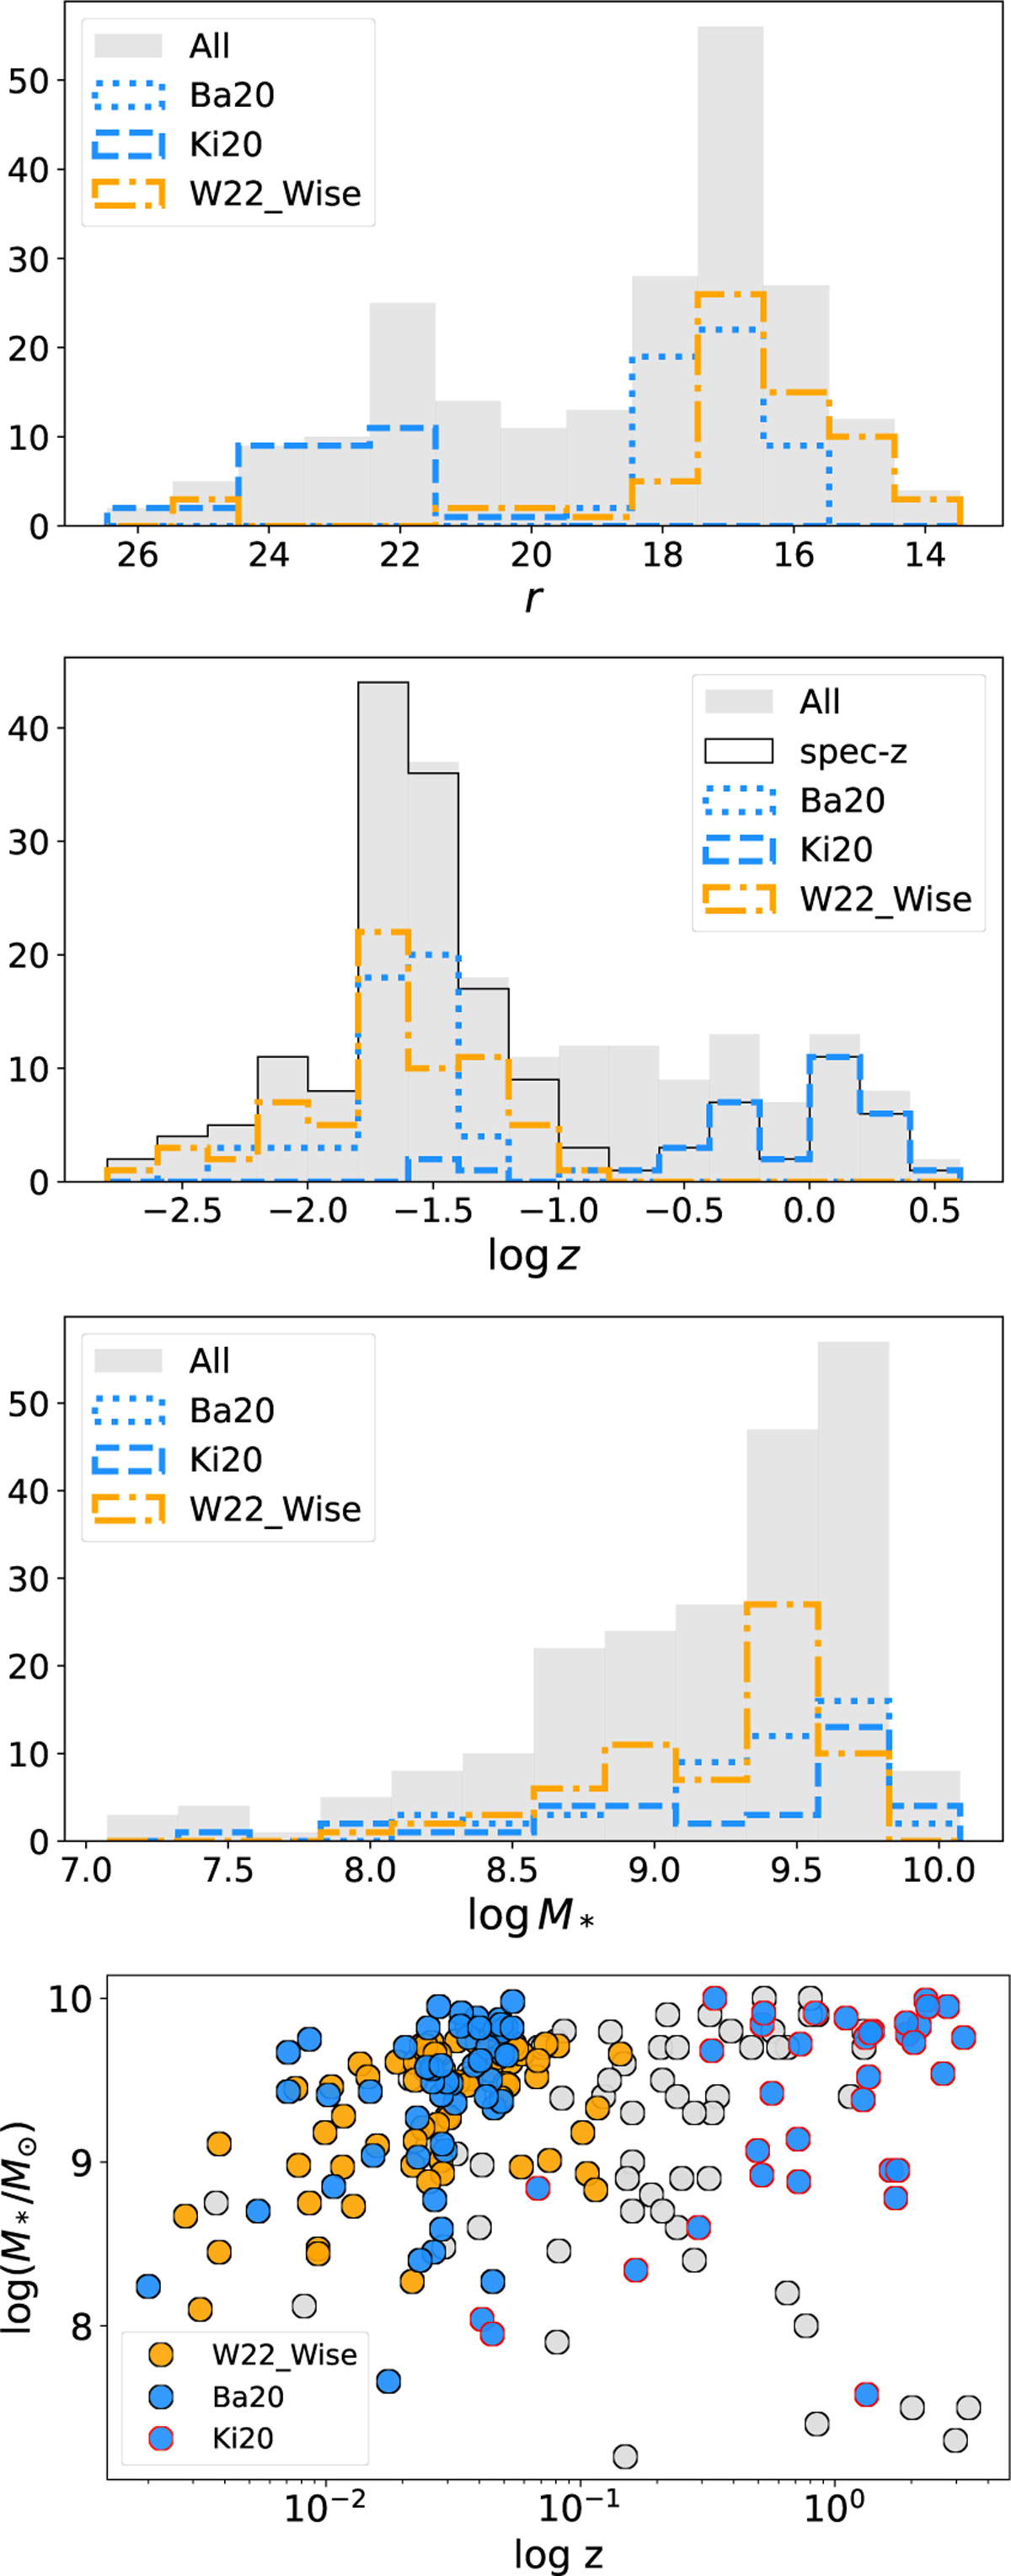
Download original image
Top three panels: the r-band magnitude, redshift and stellar mass distributions of the parent sample adopted in this work (gray-filled histograms). We highlight the shallow low-z sample from Baldassare et al. (2020) and the deep high-z sample from Kimura et al. (2020) with blue dotted and dashed lines, respectively, to highlight the bimodality in magnitude and redshift within our sample. We also highlight with an orange dot-dashed line the bulk of the IR-selected MBHs (Ward et al. 2022). Bottom panel: the redshift versus stellar mass distribution.
Current usage metrics show cumulative count of Article Views (full-text article views including HTML views, PDF and ePub downloads, according to the available data) and Abstracts Views on Vision4Press platform.
Data correspond to usage on the plateform after 2015. The current usage metrics is available 48-96 hours after online publication and is updated daily on week days.
Initial download of the metrics may take a while.