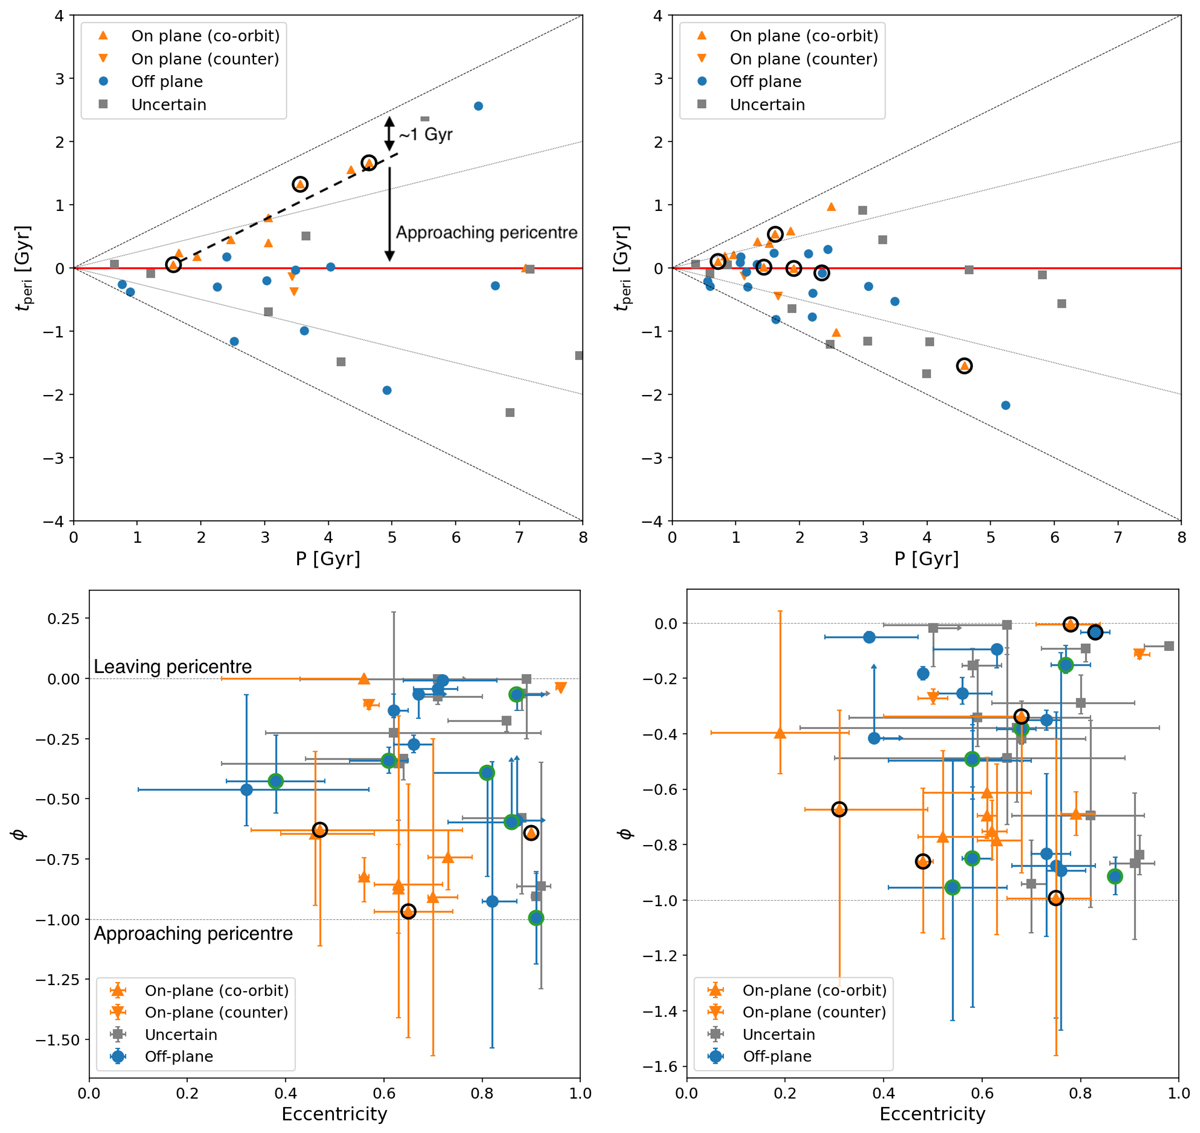
Fig. 7.
Download original image
Inspection of the orbital parameters. Top: time to the next or since the last pericentric passage, tperi, as a function of the satellites’ orbital period, P, both in units of Gyr; the red solid line at tperi = 0 indicate when satellites are at pericentre, the thin dashed lines indicate the apocentre limits, while the dotted lines mark the half-orbit; the thick dashed line, shown for illustrative purposes, is parallel to the upper apocentre line, shifted by ∼1 Gyr. Bottom: satellite orbital phases, ϕ, as a function of the orbital eccentricity; thin dotted lines represent the limits when a satellite has just left its pericentre (ϕ close to 0), or is approaching it (ϕ close to −1). Panels on the left show values obtained with the low-mass MW potential, while those on the right with the high-mass MW potential. In all panels, symbols and colours are as described in Fig. 3.
Current usage metrics show cumulative count of Article Views (full-text article views including HTML views, PDF and ePub downloads, according to the available data) and Abstracts Views on Vision4Press platform.
Data correspond to usage on the plateform after 2015. The current usage metrics is available 48-96 hours after online publication and is updated daily on week days.
Initial download of the metrics may take a while.