Fig. 6.
Download original image
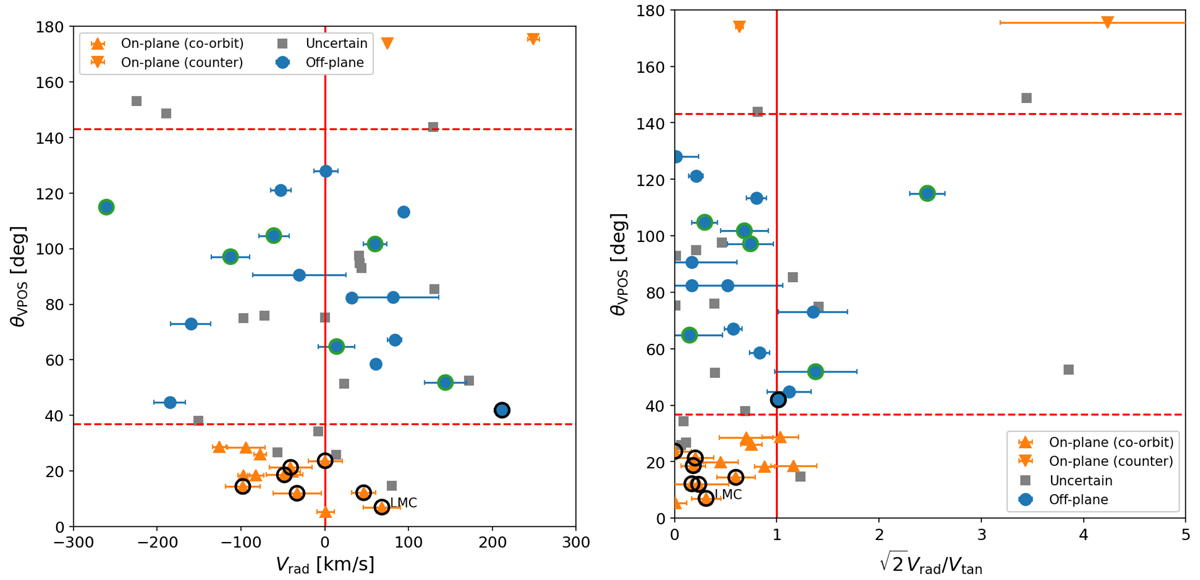
Inspection of the velocity vector components. Left: median angular difference θVPOS between the orbital poles and the VPOS normal for our sample of MW satellites, as a function of their Galactocentric radial velocity Vrad; the red solid line is for reference only, since it helps to identify satellites that are approaching the MW (Vrad[km s−1] < 0) or receding from it (Vrad[km s−1] > 0); the red dashed lines represent the aperture angles around the two opposite poles of the VPOS. Right: θVPOS as a function of the ![]() ratio; systems with
ratio; systems with ![]() , marked by the red solid line, show a tangential velocity excess. Symbols and colours in both panels as in Fig. 3; error bars for the uncertain systems, which are large, are not shown for clarity.
, marked by the red solid line, show a tangential velocity excess. Symbols and colours in both panels as in Fig. 3; error bars for the uncertain systems, which are large, are not shown for clarity.
Current usage metrics show cumulative count of Article Views (full-text article views including HTML views, PDF and ePub downloads, according to the available data) and Abstracts Views on Vision4Press platform.
Data correspond to usage on the plateform after 2015. The current usage metrics is available 48-96 hours after online publication and is updated daily on week days.
Initial download of the metrics may take a while.