Fig. 2.
Download original image
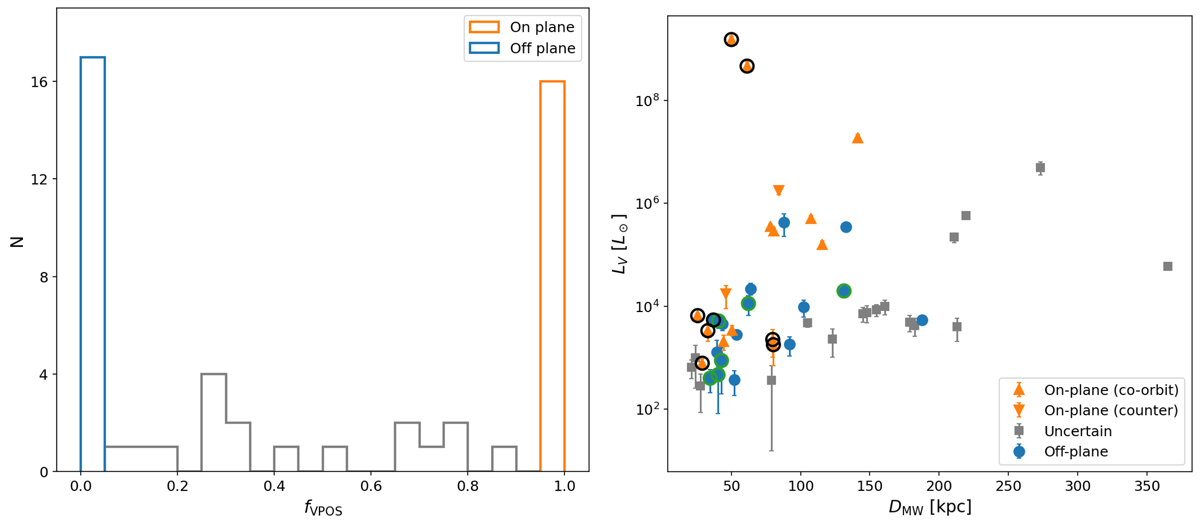
Sub-sample selection. Left: distribution of the fraction fVPOS of Monte Carlo realisation for the orbital poles of our systems that are found within the VPOS area (i.e. within θVPOS = 36.87° from the orbital pole of the VPOS normal). Right: distribution of the V-band luminosity values for our systems as a function of their Galactocentric distance. In both panels, the on-plane systems are plotted in orange, the off-plane ones in blue, while systems with intermediate fVPOS are marked in grey. In the right panel, they are plotted using filled triangles (pointing up or down depending on whether a system is co- or counter-orbiting within the VPOS), circles and squares, respectively. In addition, black circles indicate the MCs and likely associated satellites, while green circles mark those systems that are in the off-plane sample independently of their proper motions.
Current usage metrics show cumulative count of Article Views (full-text article views including HTML views, PDF and ePub downloads, according to the available data) and Abstracts Views on Vision4Press platform.
Data correspond to usage on the plateform after 2015. The current usage metrics is available 48-96 hours after online publication and is updated daily on week days.
Initial download of the metrics may take a while.