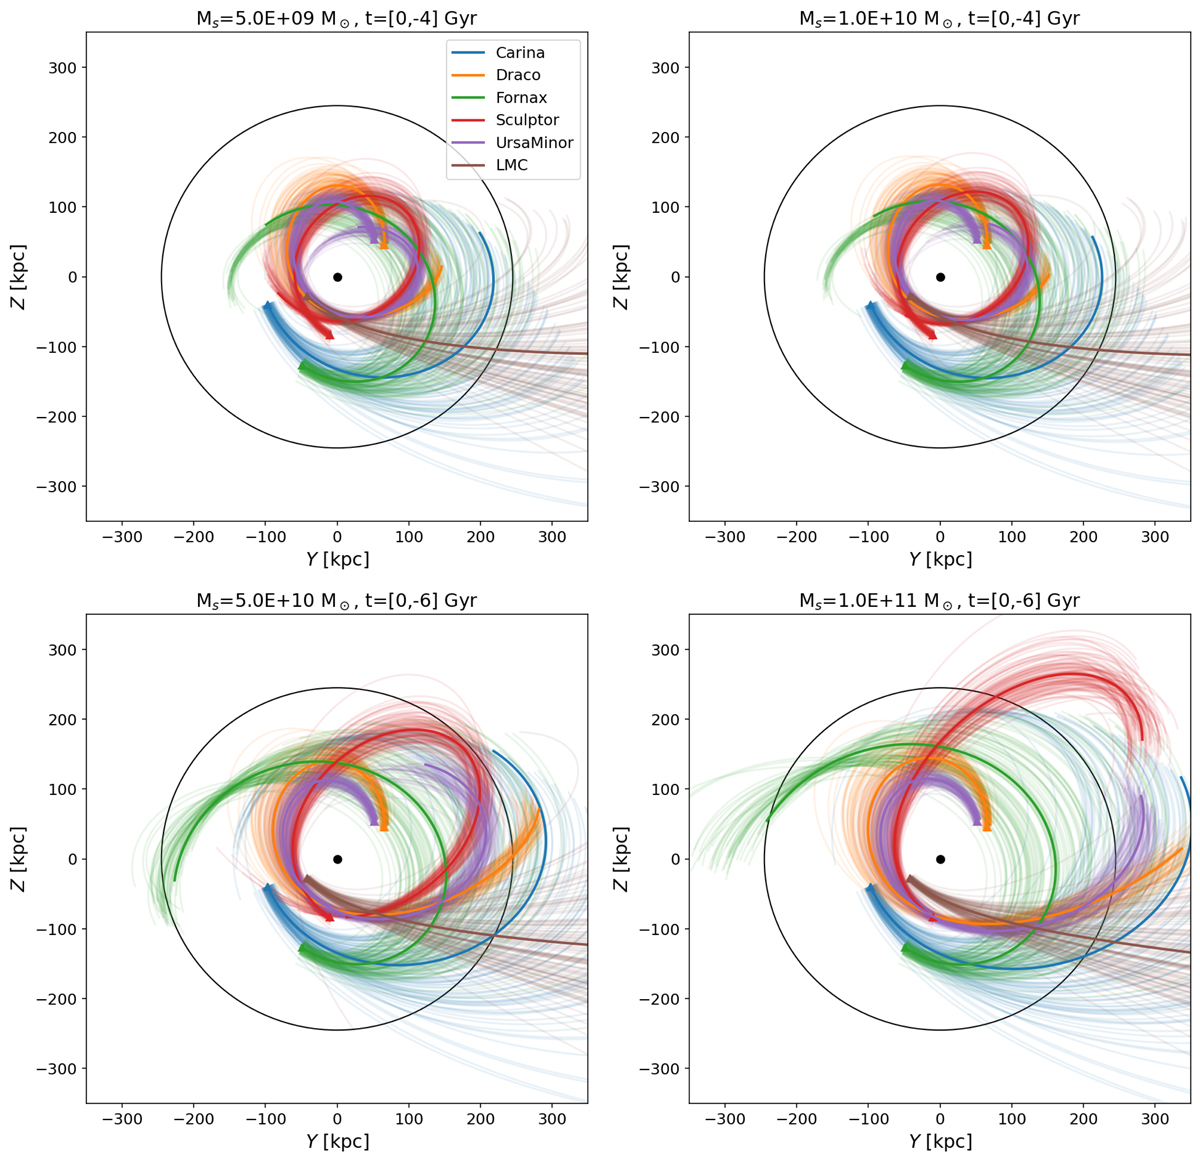
Fig. A.7.
Download original image
Panels as in Fig. A.4, but here showing the orbital evolution of the selected satellites up to 4 Gyr ago in the Galactocentric Cartesian Y − Z plane, which roughly coincides with the one defined by the VPOS. For each galaxy, we also show the orbits obtained from the 100 realisations made by Monte-Carlo sampling of the position and velocity vector, as in Fig. A.5. The circle in each panel has the same radius as the virial radius of the MW, rvir = 245 kpc.
Current usage metrics show cumulative count of Article Views (full-text article views including HTML views, PDF and ePub downloads, according to the available data) and Abstracts Views on Vision4Press platform.
Data correspond to usage on the plateform after 2015. The current usage metrics is available 48-96 hours after online publication and is updated daily on week days.
Initial download of the metrics may take a while.