Fig. A.5.
Download original image
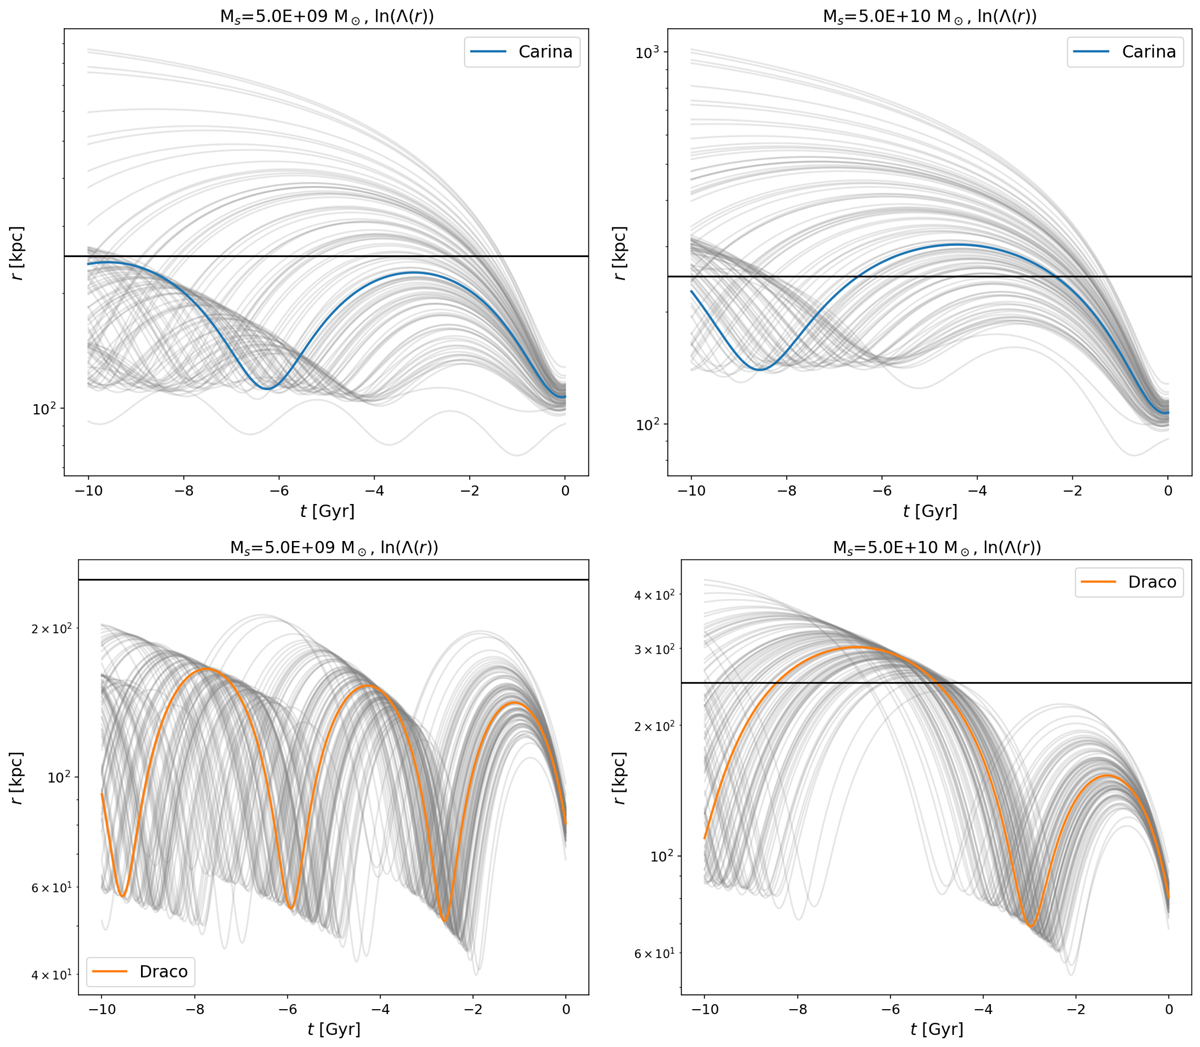
As in Fig. A.4, but here showing the impact of uncertainties on the orbital evolution of the individual systems. For each galaxy, we show as grey lines 100 realisations made by a Monte-Carlo sampling of the position and velocity vector, taking into account errors on distance, proper motion and radial velocity. We show results assuming that the satellites have a total mass of MS = 5 × 10⁹ M⊙ (left panels) and MS = 5 × 10¹⁰ M⊙ (right panels); the black solid line in all panels represents the MW virial radius rvir = 245 kpc.
Current usage metrics show cumulative count of Article Views (full-text article views including HTML views, PDF and ePub downloads, according to the available data) and Abstracts Views on Vision4Press platform.
Data correspond to usage on the plateform after 2015. The current usage metrics is available 48-96 hours after online publication and is updated daily on week days.
Initial download of the metrics may take a while.