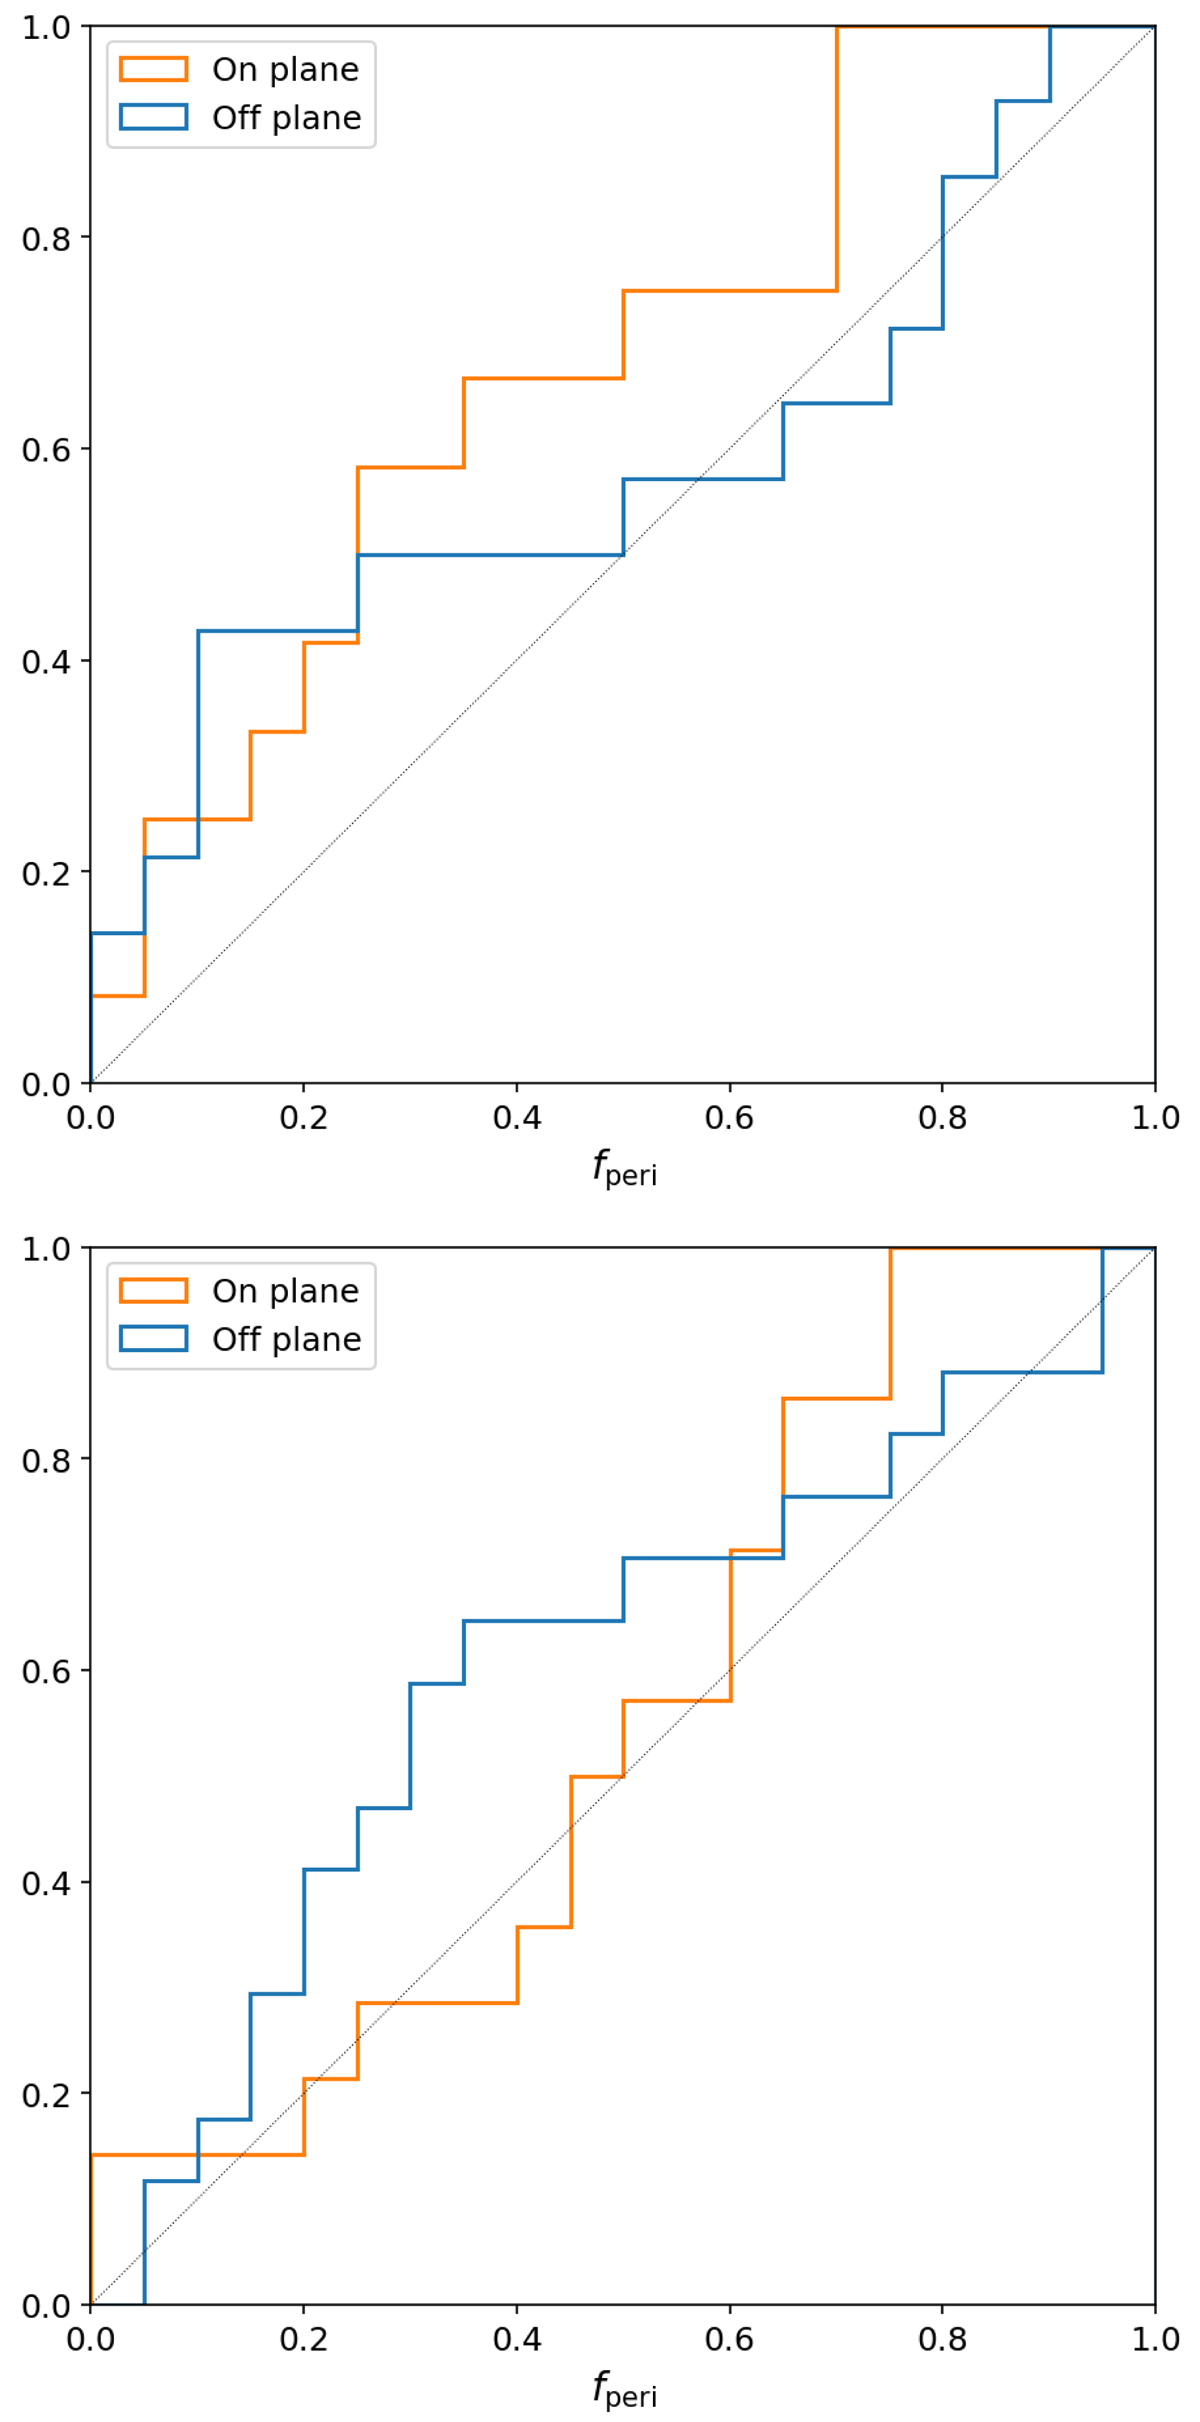
Fig. A.1.
Download original image
Cumulative distributions of fperi, the fractional distance in time between the pericentre (fperi = 0) and the apocentre (fperi = 1), for the on-plane (orange solid lines) and off-plane (blue solid lines) samples, considering values obtained with the low-mass (top panel) and high-mass (bottom panel) MW potentials. Dashed lines represent the expectation of a uniform distribution for each sub-sample.
Current usage metrics show cumulative count of Article Views (full-text article views including HTML views, PDF and ePub downloads, according to the available data) and Abstracts Views on Vision4Press platform.
Data correspond to usage on the plateform after 2015. The current usage metrics is available 48-96 hours after online publication and is updated daily on week days.
Initial download of the metrics may take a while.