Fig. 1.
Download original image
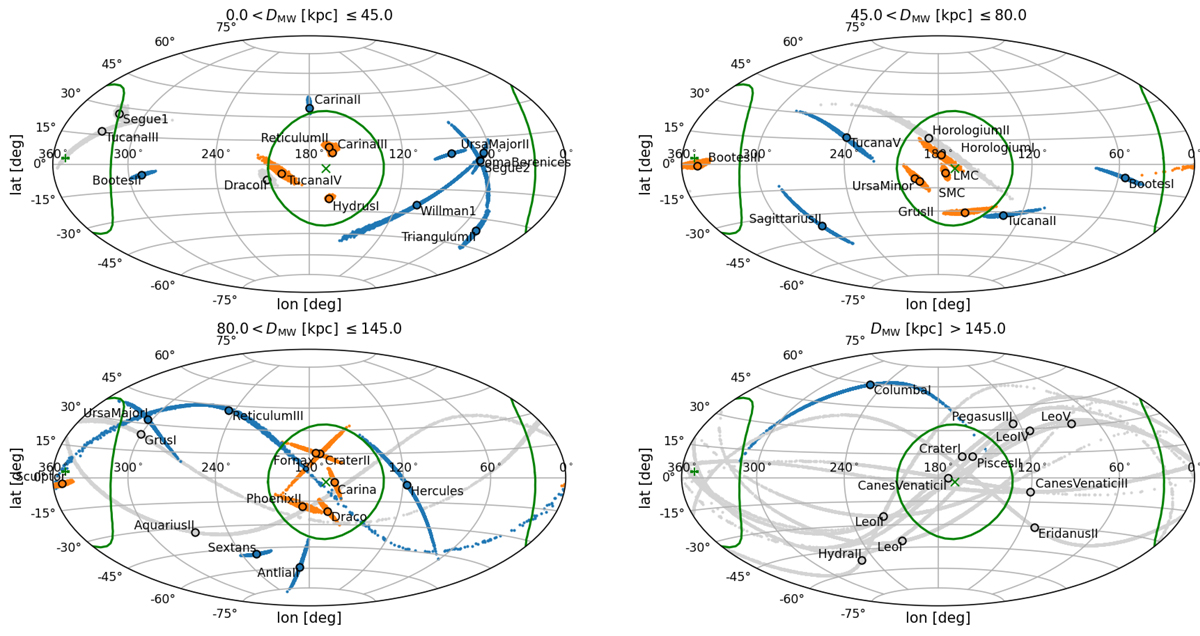
Distribution of orbital poles in Galactic coordinates for the analysed sample of MW satellites. The median orbital poles are shown as open black circles, while the values of 5000 Monte Carlo realisations drawing on measurement uncertainties are shown as coloured dots. The colour scheme follows the division of our sample into on-plane (orange dots), off-plane (blue dots) and uncertain systems (grey dots) detailed in Sect. 2.
Current usage metrics show cumulative count of Article Views (full-text article views including HTML views, PDF and ePub downloads, according to the available data) and Abstracts Views on Vision4Press platform.
Data correspond to usage on the plateform after 2015. The current usage metrics is available 48-96 hours after online publication and is updated daily on week days.
Initial download of the metrics may take a while.