Fig. 5.
Download original image
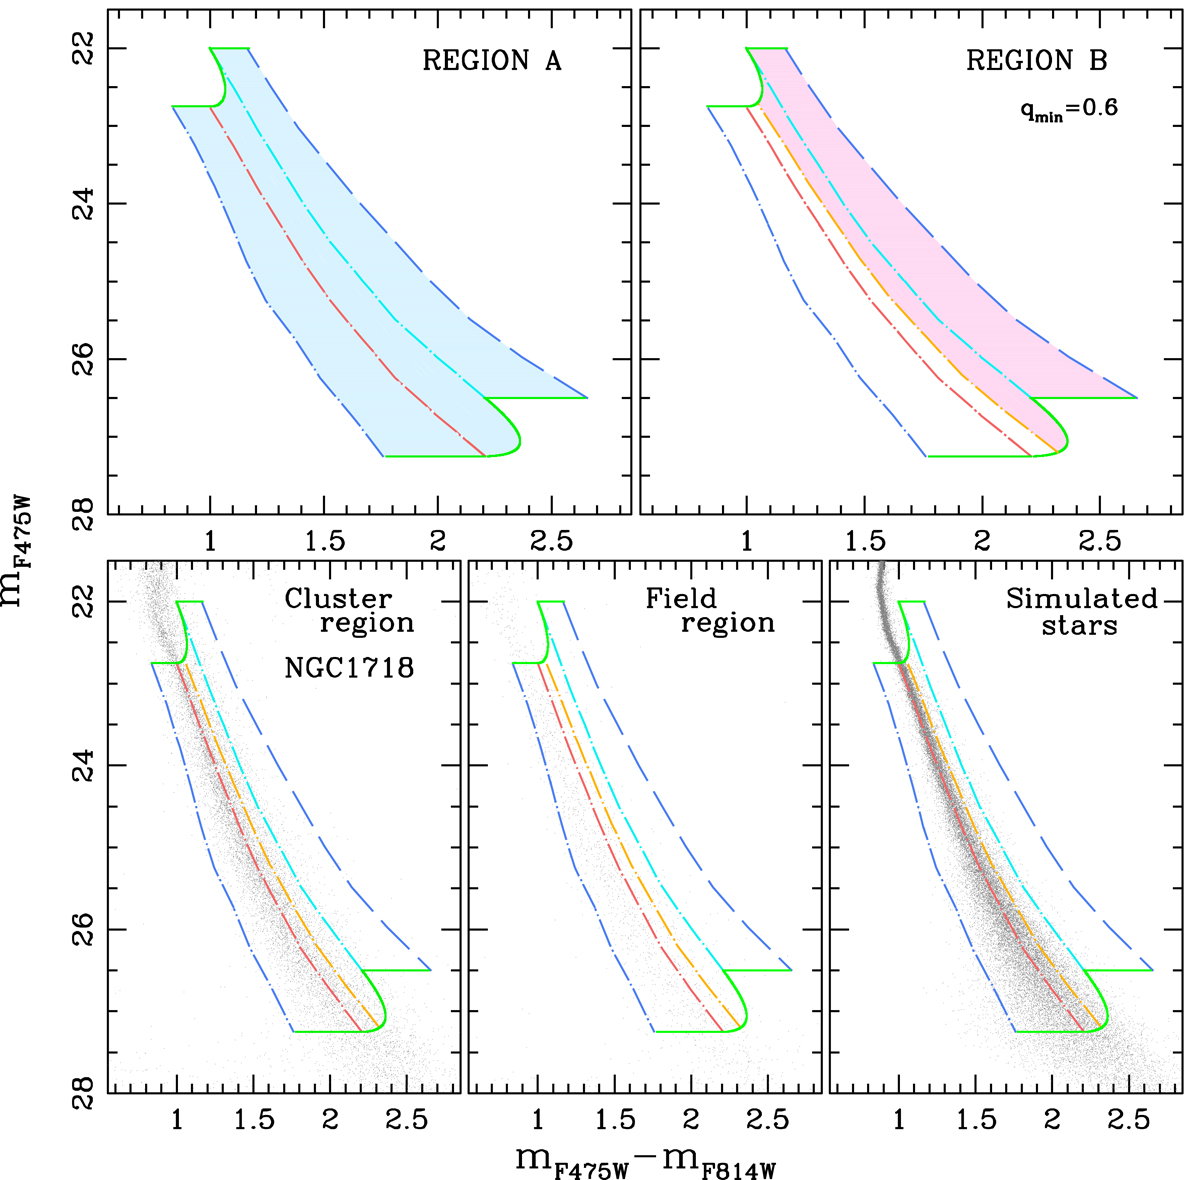
Method of analysis. The figure summarises the method that was used to analyse MS-MS binaries in NGC 1718. Top-left panel: region A of the mF475W vs. mF475W − mF814W CMD, which is shaded with light-blue colour. Top-right panel: region B, a subsection of region A, is shaded with a pink. Bottom-left: CMDs of stars in the cluster region. Bottom-centre: field region. Bottom-right: simulated CMD. The MS fiducial line and the fiducial of equal-mass binaries are represented with red and cyan dot-dashed lines, respectively, in all panels. The blue dot-dashed and blue-dashed lines mark the left and right color boundaries of region A, displaced by three times the colour error from the fiducial and equal mass binary lines, respectively. Green curves represent the mass limit of analysis, i.e., binaries with certain primary mass and the mass ratio with secondary mass ranging between 0 and 1. Orange lines represent the unequal mass binary line, i.e., binaries with a mass ratio, q = 0.6. See text for details.
Current usage metrics show cumulative count of Article Views (full-text article views including HTML views, PDF and ePub downloads, according to the available data) and Abstracts Views on Vision4Press platform.
Data correspond to usage on the plateform after 2015. The current usage metrics is available 48-96 hours after online publication and is updated daily on week days.
Initial download of the metrics may take a while.