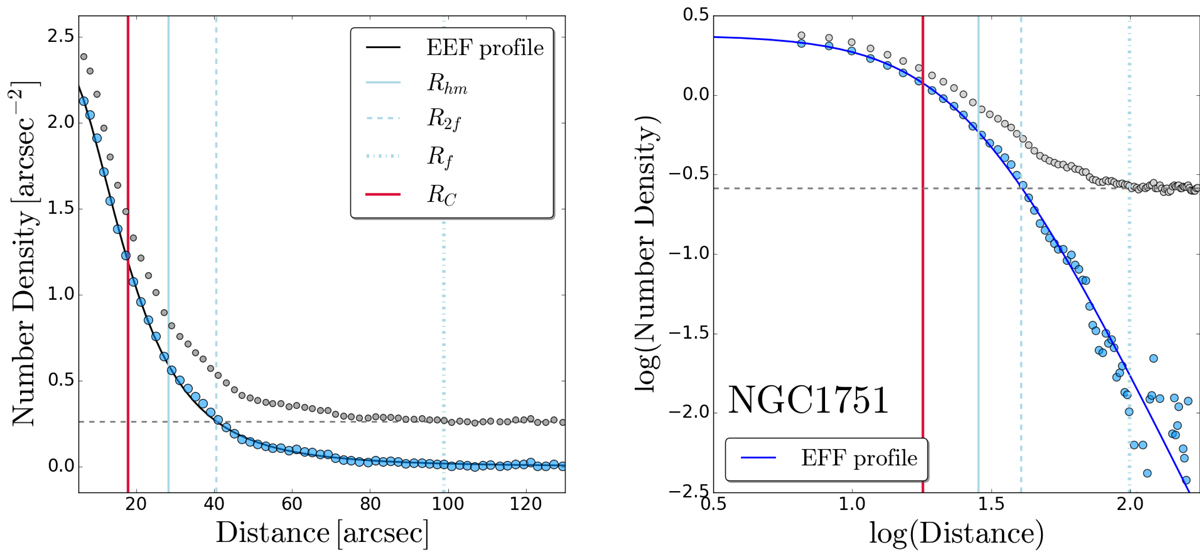
Fig. 3.
Download original image
Density profile. Left panel: grey points correspond to the observed density profile of the cluster NGC 1751. The contribution from field contamination is denoted by the grey dotted horizontal line. The profile in blue is obtained after subtracting the background contamination from the actual density estimate, and it is fitted with the EEF profile. Right panel: corresponding quantities in a logarithmic scale. The vertical lines indicate the core radius, the corresponding half-mass radius denoted by Rhm, and the distances indicated as Rf and R2f. The background level (bg) is marked by a horizontal line.
Current usage metrics show cumulative count of Article Views (full-text article views including HTML views, PDF and ePub downloads, according to the available data) and Abstracts Views on Vision4Press platform.
Data correspond to usage on the plateform after 2015. The current usage metrics is available 48-96 hours after online publication and is updated daily on week days.
Initial download of the metrics may take a while.