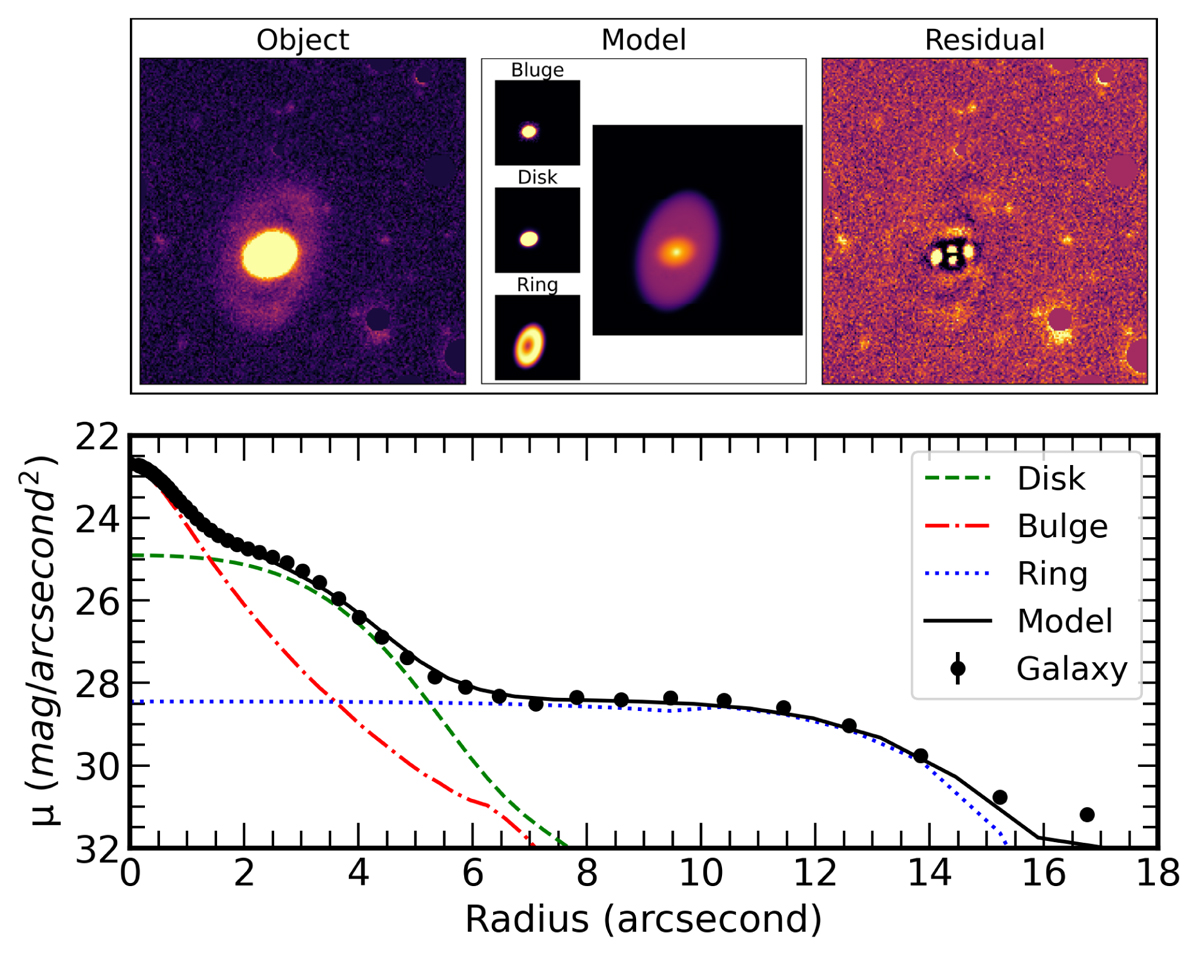
Fig. 3.
Download original image
Top image, left panel: DECaLS r-band image of the DJ0240. Centre panel: subcomponents and the total model obtained from the modelling process. Right panel: residual image. Bottom image: surface brightness profile for the DECaLS r-band image. Various coloured lines are used to represent the subcomponents. Specifically, the dotted blue line corresponds to the truncated Sersic function, which represents the ring component.
Current usage metrics show cumulative count of Article Views (full-text article views including HTML views, PDF and ePub downloads, according to the available data) and Abstracts Views on Vision4Press platform.
Data correspond to usage on the plateform after 2015. The current usage metrics is available 48-96 hours after online publication and is updated daily on week days.
Initial download of the metrics may take a while.