Fig. 7
Download original image
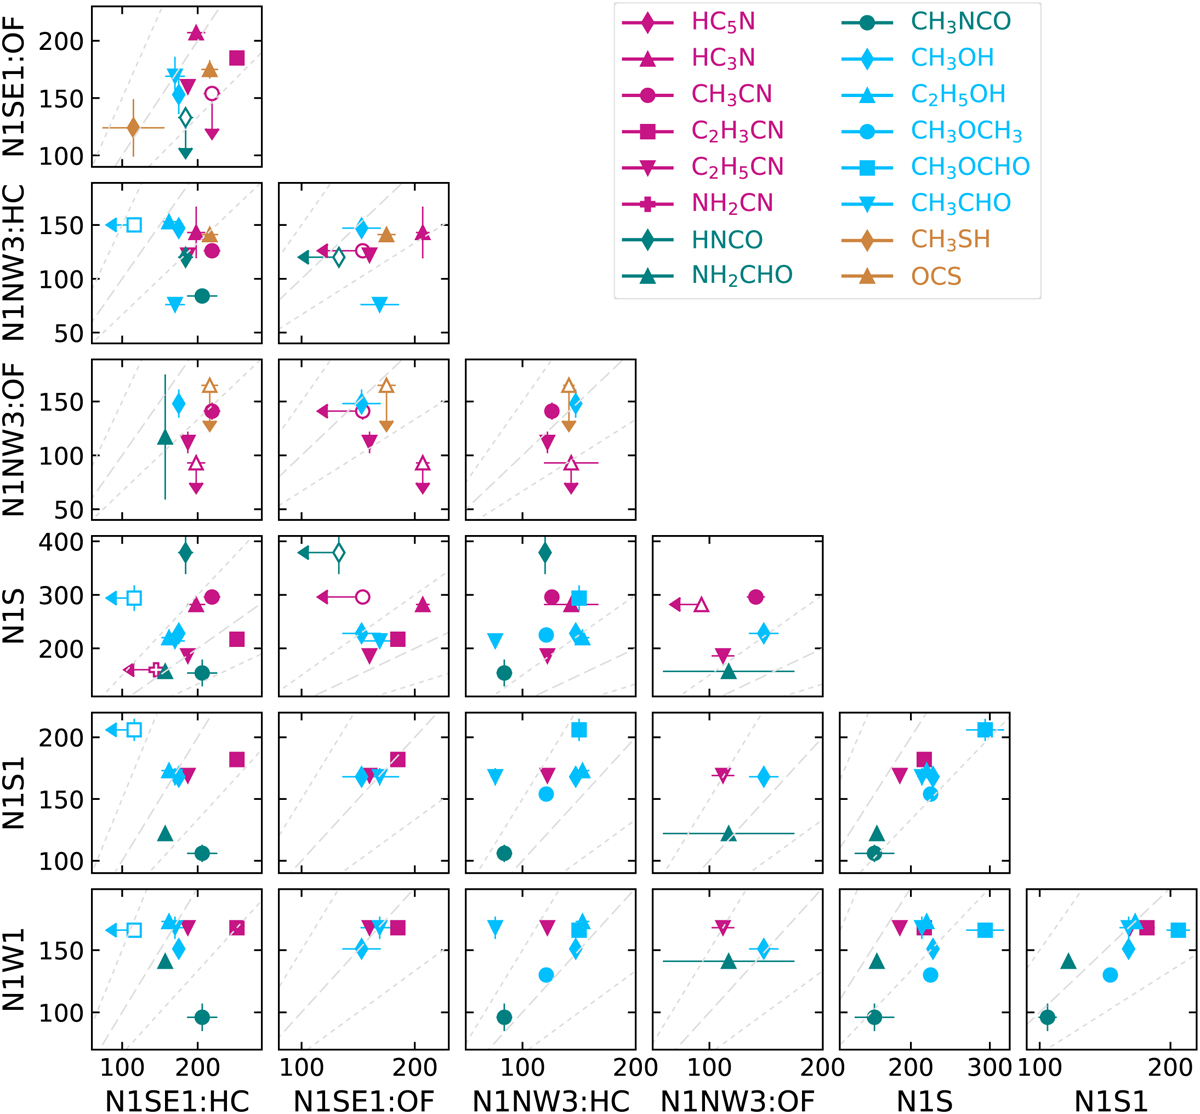
Rotational temperatures (in K) for various positions towards Sgr B2 (N1) derived with the population diagram analysis. Pink markers indicate N-bearing species, teal markers (N+O)-bearers, blue O-bearers, and orange S-bearers. Arrows indicate upper limits. The grey dashed line shows where temperatures are equal. The two grey dotted lines indicate a factor 1.5 difference.
Current usage metrics show cumulative count of Article Views (full-text article views including HTML views, PDF and ePub downloads, according to the available data) and Abstracts Views on Vision4Press platform.
Data correspond to usage on the plateform after 2015. The current usage metrics is available 48-96 hours after online publication and is updated daily on week days.
Initial download of the metrics may take a while.