Open Access
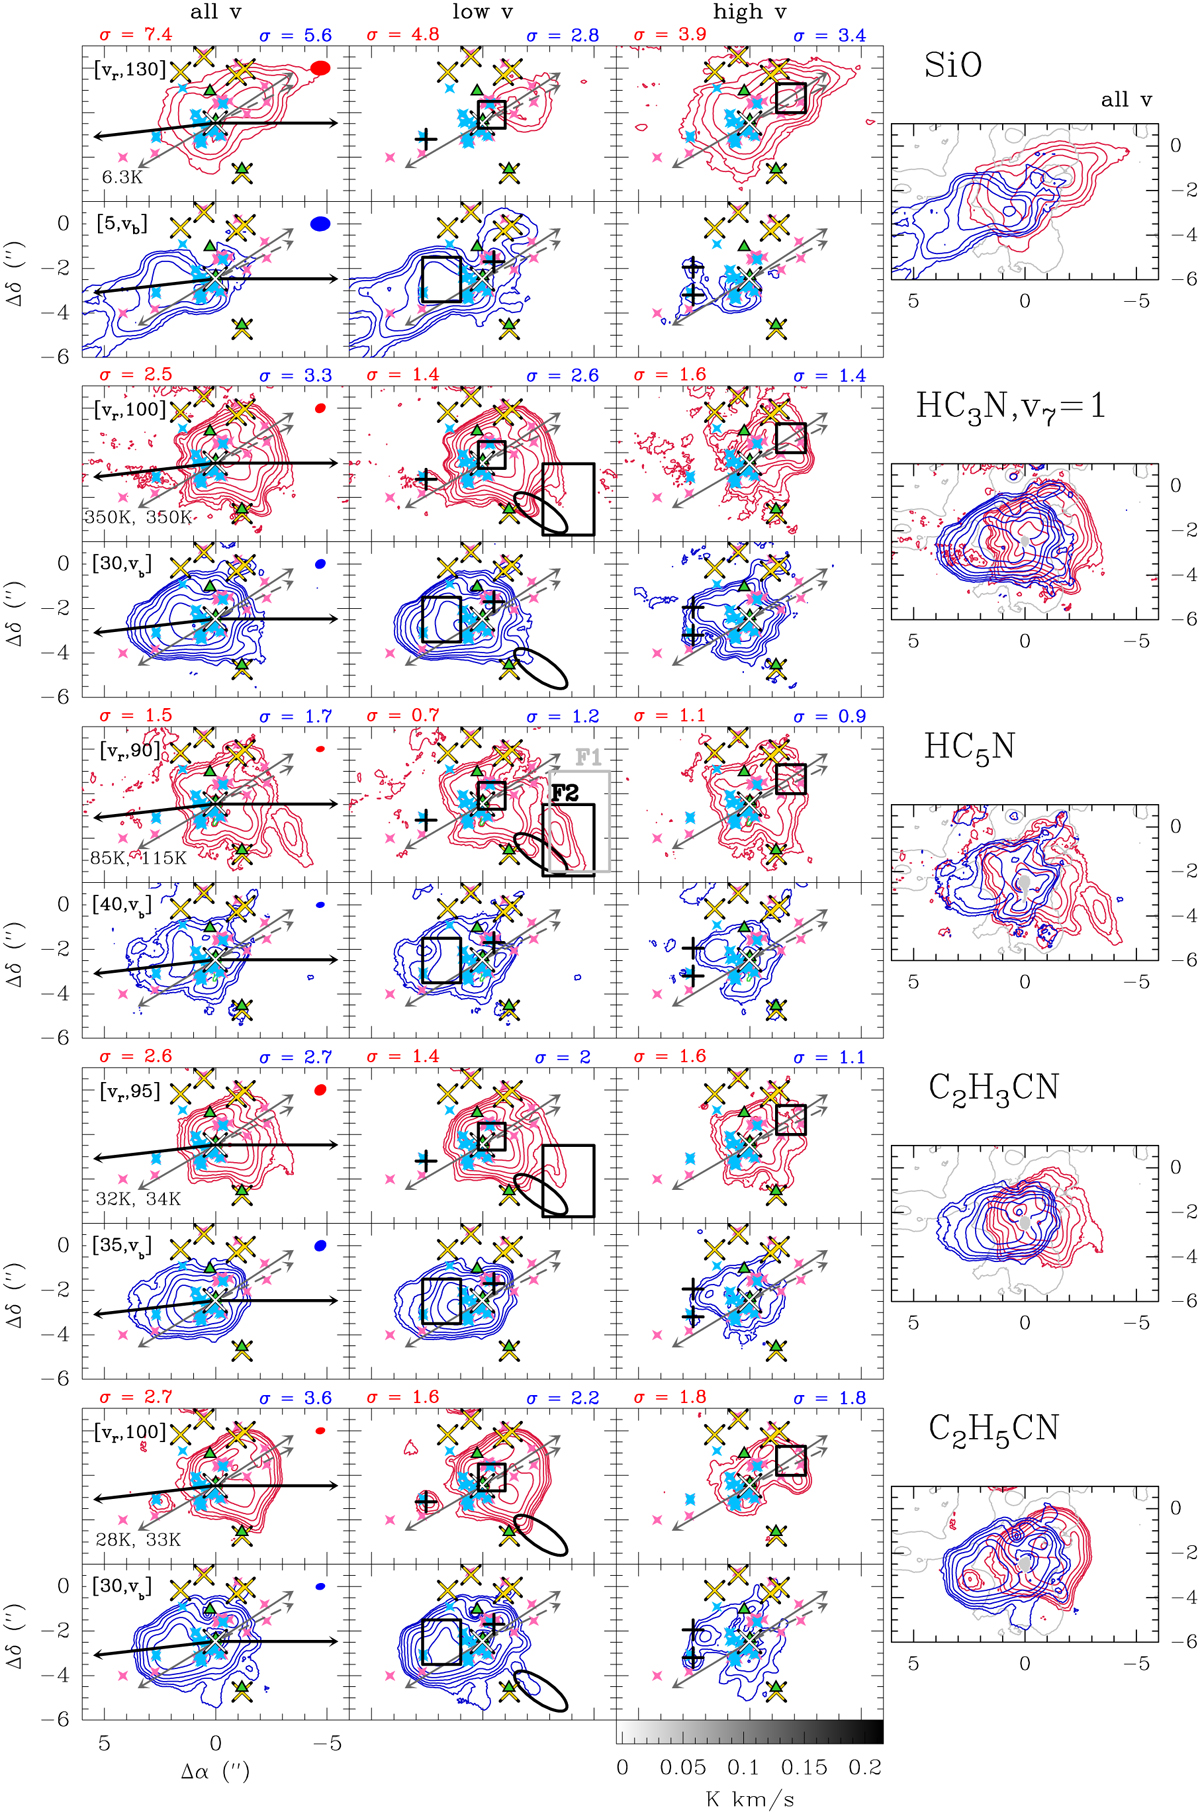
Fig. C.2
Download original image
Same as Fig. C.1, but for N-bearing molecules. The LVINE method could not be used for SiO, because of absorption features. The all-v maps were computed as in Fig 2, while the intermediate integration limits that divide the spectrum into the low-v and high-v portions at each pixel were taken from SO.
Current usage metrics show cumulative count of Article Views (full-text article views including HTML views, PDF and ePub downloads, according to the available data) and Abstracts Views on Vision4Press platform.
Data correspond to usage on the plateform after 2015. The current usage metrics is available 48-96 hours after online publication and is updated daily on week days.
Initial download of the metrics may take a while.