Fig. A.1
Download original image
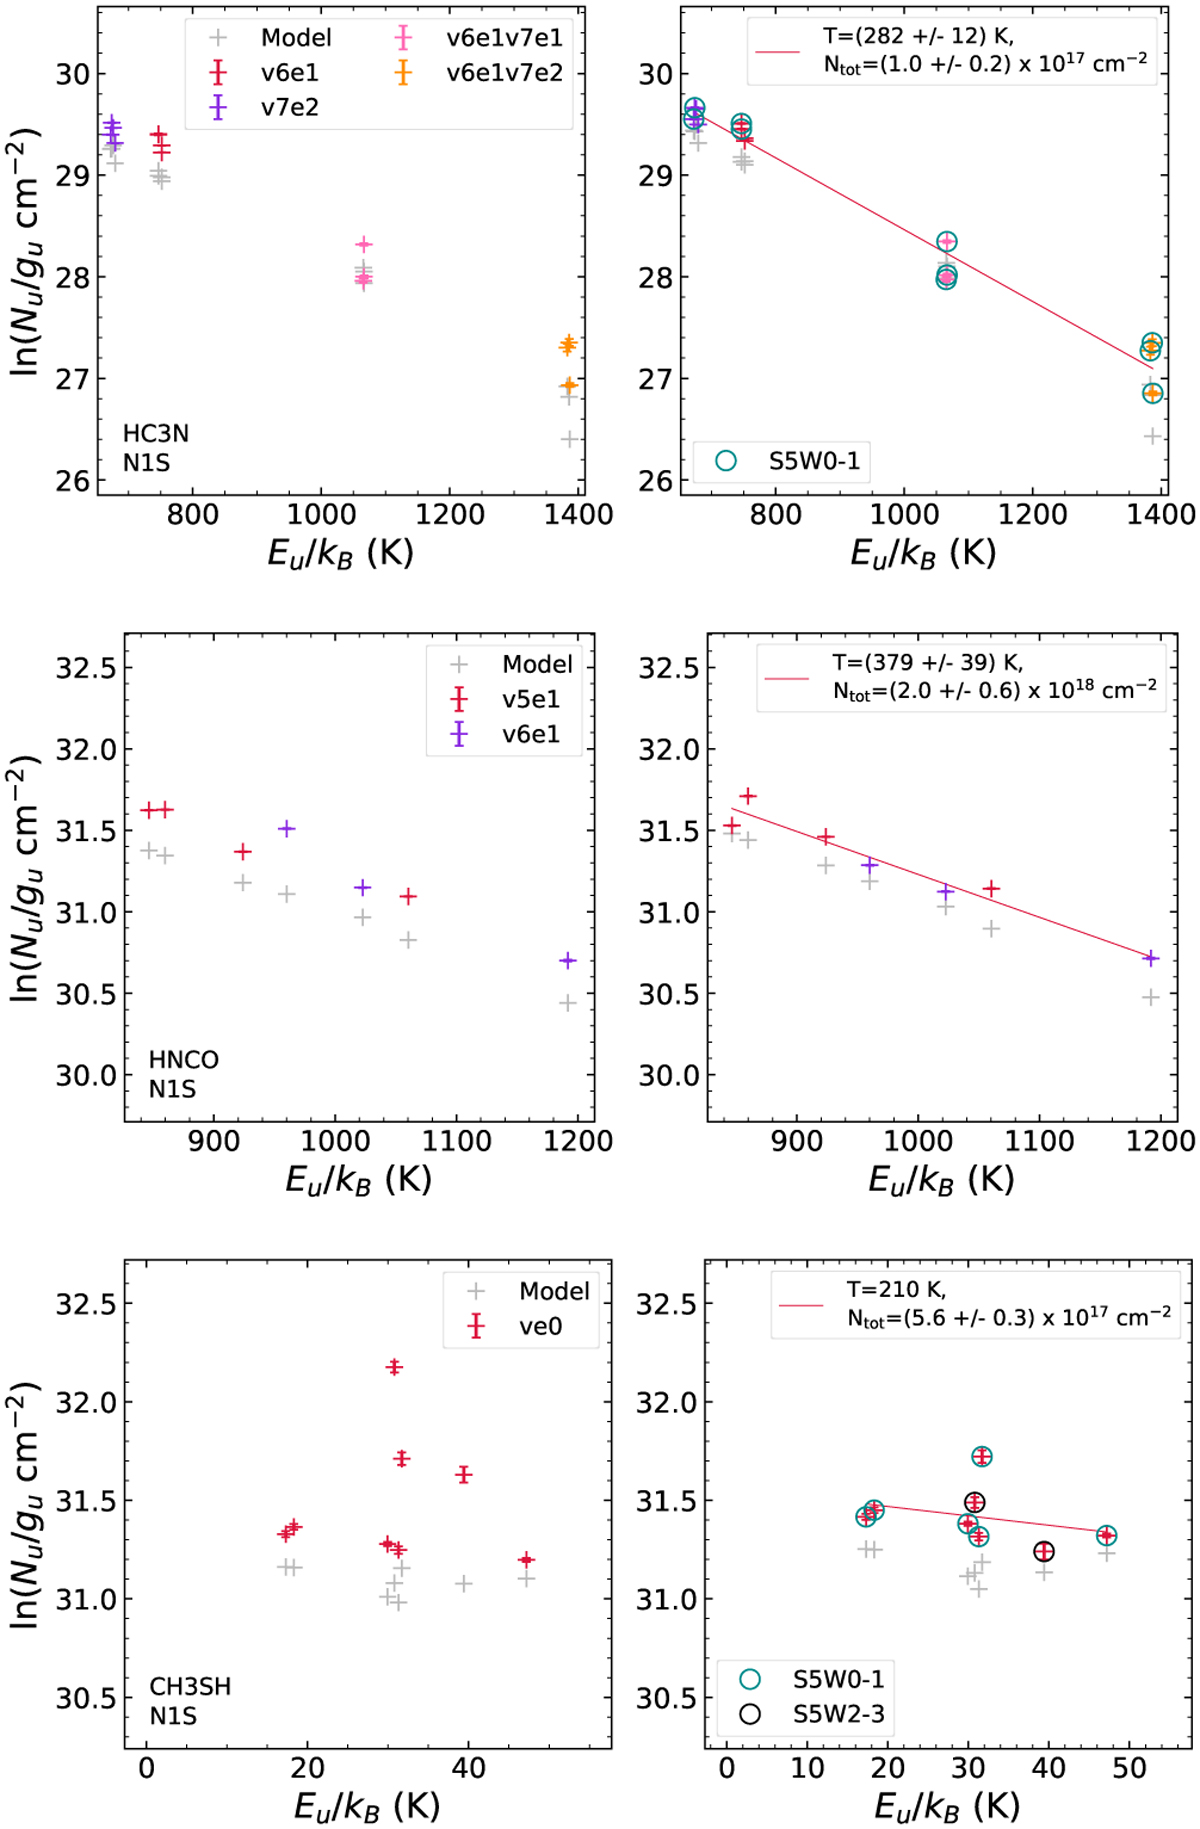
Population diagrams for HC3N, HNCO, and CH3SH at position N1S. Observed data points are shown in various colours as indicated in the top right corner of the respective left plot, while synthetic data points are shown in grey. No corrections are applied in the respective left panels, while in the right plots corrections for opacity and contamination by other molecules have been considered for both the observed and synthetic populations. The red line is a linear fit to all observed data points (in linear-logarithmic space), where for CH3SH the temperature was fixed. The results of the fits are shown in the respective right panels. Teal and black circles show observed data points from spectral windows 0–1 and 2–3 of observational setup 5, respectively, as indicated in the bottom left corner in the right panels.
Current usage metrics show cumulative count of Article Views (full-text article views including HTML views, PDF and ePub downloads, according to the available data) and Abstracts Views on Vision4Press platform.
Data correspond to usage on the plateform after 2015. The current usage metrics is available 48-96 hours after online publication and is updated daily on week days.
Initial download of the metrics may take a while.