Fig. 11
Download original image
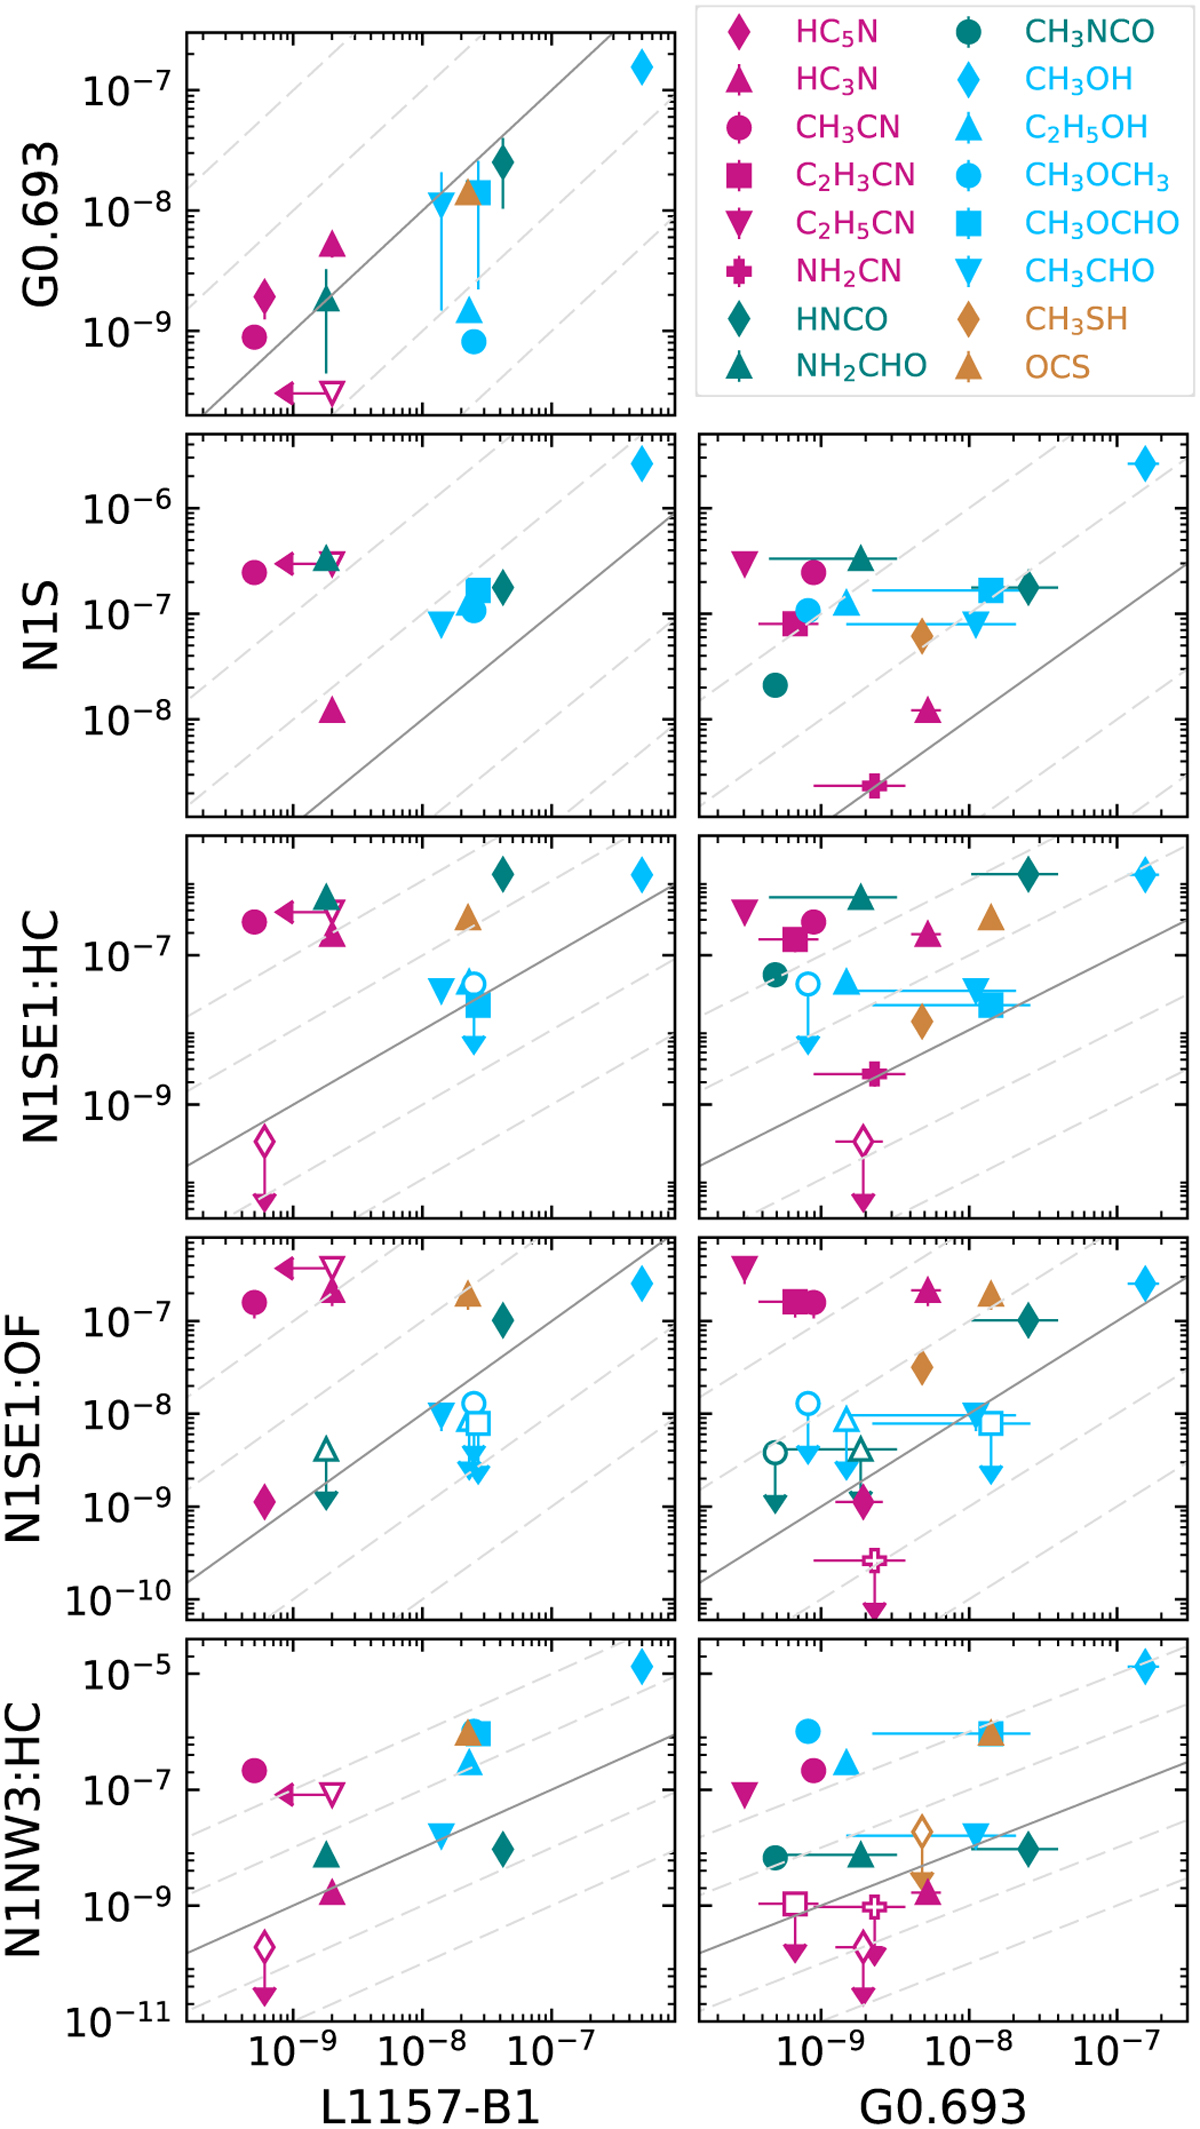
Molecular abundances with respect to H2 for the outflow (OF) and hot-core (HC) components at N1SE1, for N1NW3:HC, and for N1S, G0.693, and L1157-B1. Colours signify the same as in Fig. 7. Unfilled markers with arrows indicate upper limits. The grey solid line shows where abundances are equal. The grey dotted lines indicate factors 10 and 100 deviation from the solid line.
Current usage metrics show cumulative count of Article Views (full-text article views including HTML views, PDF and ePub downloads, according to the available data) and Abstracts Views on Vision4Press platform.
Data correspond to usage on the plateform after 2015. The current usage metrics is available 48-96 hours after online publication and is updated daily on week days.
Initial download of the metrics may take a while.