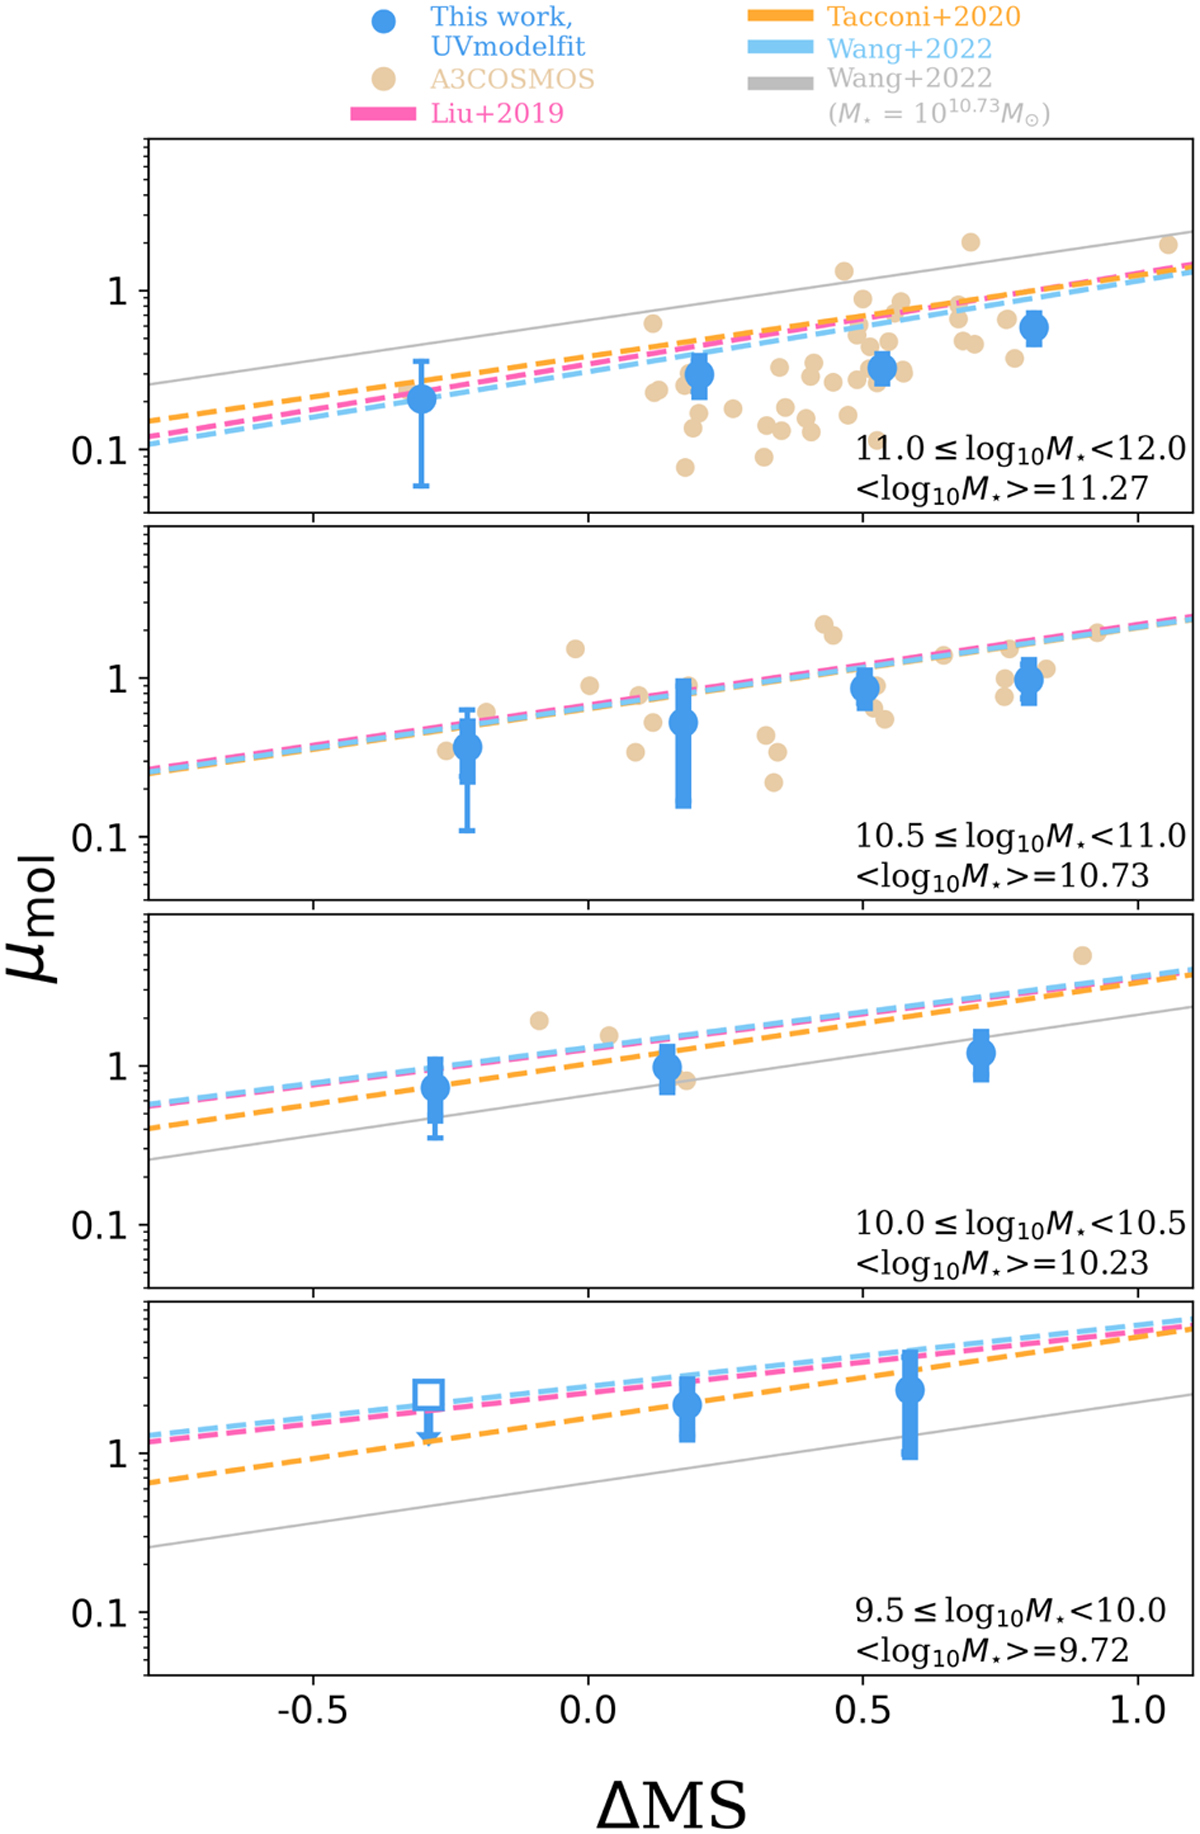
Fig. 6
Download original image
Molecular gas fraction (i.e., µmol = Mgas /M⋆) of SFGs at 𝓏 ~1.4 as a function of their distance to the MS (i.e., ∆MS) and their stellar mass. Blue circles show the mean molecular gas fraction from our work. The square displays the upper limit for the bin with no detection in both the uv domain and image domain. The thick error bars display the instrumental uncertainty in each bin, while the thin error bars show the total uncertainty, i.e., including both the instrumental noise and the uncertainties due to the intrinsic dispersion of the molecular gas fraction within the stacked population. Salmon-colored circles represent individually detected galaxies taken from the latest A3 COSMOS catalog (S/N > 4.35; Adscheid et al., in prep.), applying the same method used here to convert these flux densities into molecular gas mass. Dashed lines display the analytical relations of the molecular gas fraction at different stellar mass and ∆MS from Liu et al. (2019a, pink), Tacconi et al. (2020, orange), and Wang et al. (2022, blue). Gray lines show the analytical relation from Wang et al. (2022) at M⋆ = 1010.73 M⊙ as a reference, which is the same stellar mass as in the second panel.
Current usage metrics show cumulative count of Article Views (full-text article views including HTML views, PDF and ePub downloads, according to the available data) and Abstracts Views on Vision4Press platform.
Data correspond to usage on the plateform after 2015. The current usage metrics is available 48-96 hours after online publication and is updated daily on week days.
Initial download of the metrics may take a while.