Fig. 4
Download original image
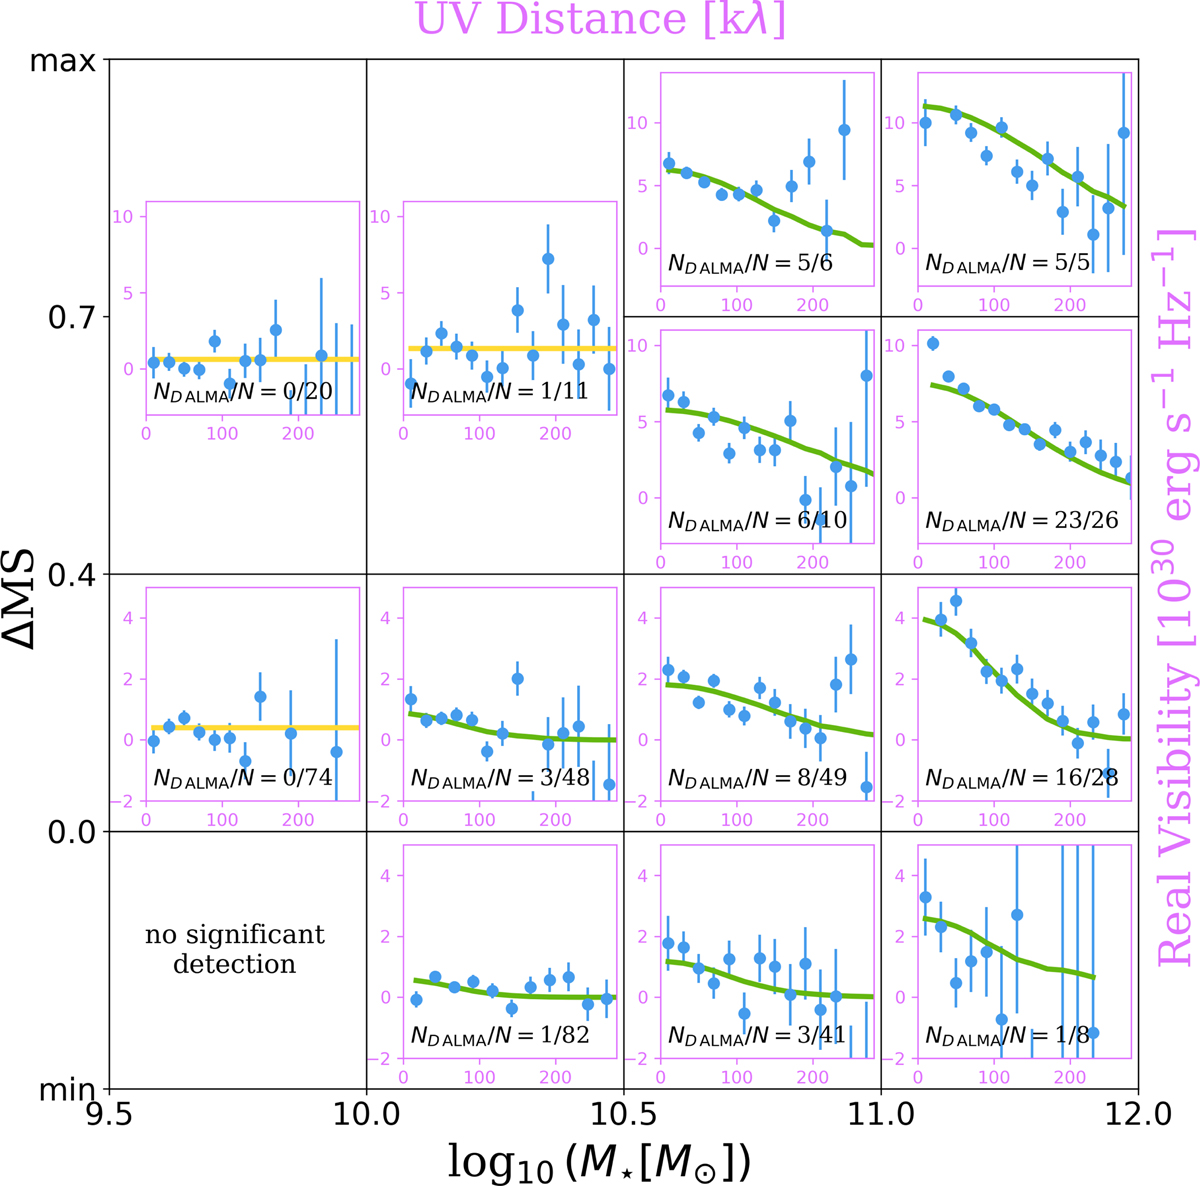
Results in uυ-domain of our ALMA stacking analysis. In each panel, a single component model (green solid line for Gaussian profile and yellow solid line for point source) has been fit to the mean visibility amplitudes (blue filled circles) using the CASA task uvmodelfit. The maximun values of ∆MS from the lowest to highest stellar mass bins are 1.3, 0.9, 1.0, and 1.1; and the minimum values from the lowest to highest stellar mass bins are −0.7, −0.7, −0.7, and −0.6, respectively. The number of individually detected galaxies in the ALMA archival images (ND ALMA) and the number of stacked galaxies (N) is also reported in each panel.
Current usage metrics show cumulative count of Article Views (full-text article views including HTML views, PDF and ePub downloads, according to the available data) and Abstracts Views on Vision4Press platform.
Data correspond to usage on the plateform after 2015. The current usage metrics is available 48-96 hours after online publication and is updated daily on week days.
Initial download of the metrics may take a while.