Fig. 17
Download original image
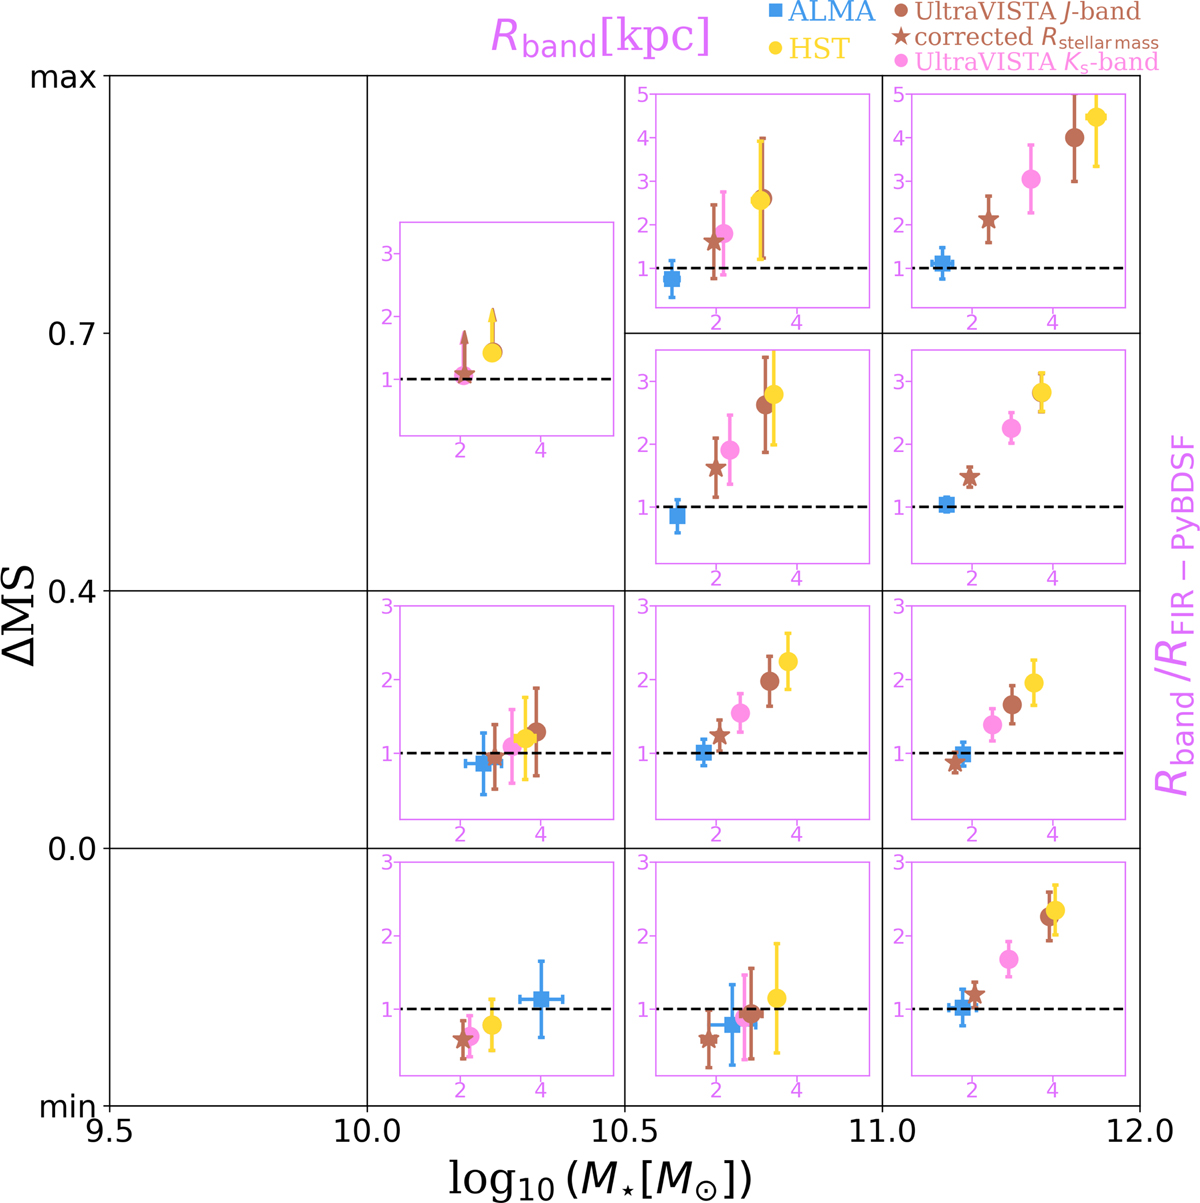
Ratio of effective radius in different bands to effective radius in FIR measured by fitting a single Gaussian to our original ALMA stacked images. Yellow, brown, and pink circles correspond the optical size measured from the HST i-band, UltraVISTA J-band, and UltraVISTA Ks-band light profiles, respectively. Blue squares display the FIR size measured from the ALMA light profile. Brown stars show the stellar mass effective radius inferred by correcting our UltraVISTA J-band sizes with a Rhalf-stellar-light-to-Rhalf-stellar-mass relation at rest 5000 Å from Suess et al. (2019). We provide lower limits of the size ratio in the highest ΔMS and 1010.0 ≤ M★ /M⊙ < 1010.5 bin because these galaxies are unresolved in our ALMA stacked images. The maximun value of ΔMS for the mid-low, mid-high, and high stellar mass bin are 0.9, 1.0, and 1.1; and the minimum value for the mid-low, mid-high, and high stellar mass bin are −0.7, −0.7, and −0.6, respectively.
Current usage metrics show cumulative count of Article Views (full-text article views including HTML views, PDF and ePub downloads, according to the available data) and Abstracts Views on Vision4Press platform.
Data correspond to usage on the plateform after 2015. The current usage metrics is available 48-96 hours after online publication and is updated daily on week days.
Initial download of the metrics may take a while.