Fig. 11
Download original image
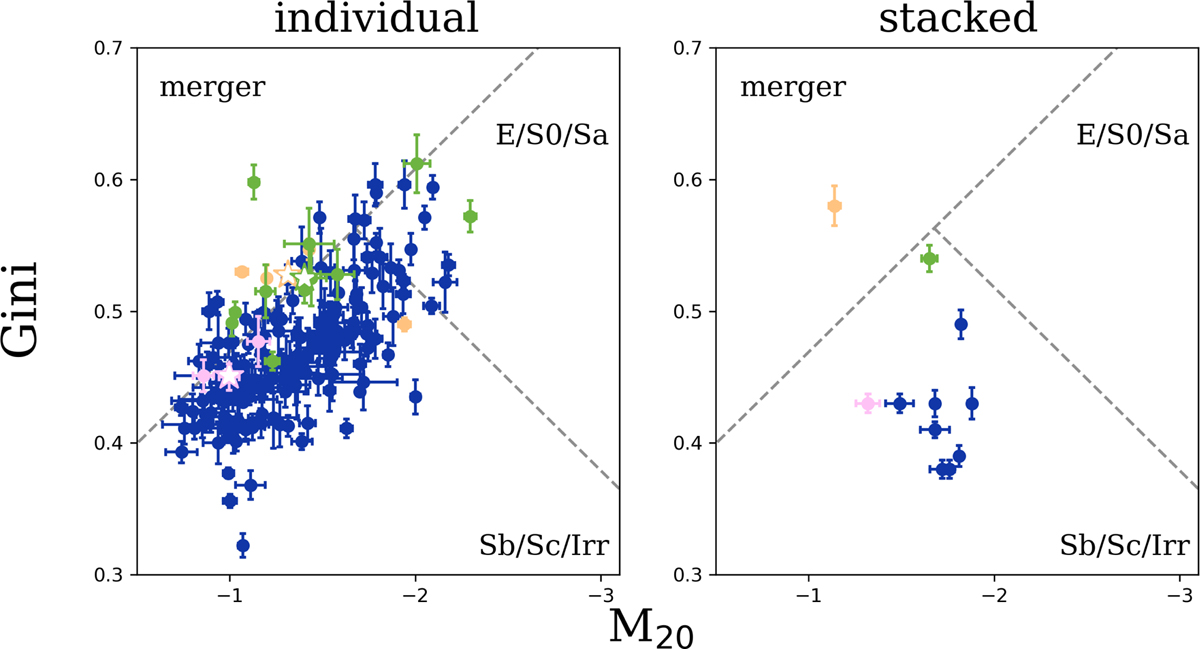
Morphological classification of our M★ > 1010 M⊙ SFGs measured on their HST i-band images. Circles in the left panel are the Gini and M20 coefficient measured on HST i-band images of each individual galaxy, while the right panel shows the Gini and M20 coefficient measured for the stacked images of the different stellar mass and ∆MS bin. Orange, pink, green, and dark blue show SBs (∆MS > 0.7) at 1011 ≤ M★/M⊙ < 1012, SBs at 1010.5 < M★/M⊙ < 1011, SBs at 1010 < M★/M⊙ < 10105, and M★> 1010 M⊙ SFGs without SBs (∆MS < 0.7), respectively. Stars in the left panel are the median Gini and M20 coefficients of SBs in these three stellar mass bins. Gray dashed lines are the morphology classification from Lotz et al. (2008).
Current usage metrics show cumulative count of Article Views (full-text article views including HTML views, PDF and ePub downloads, according to the available data) and Abstracts Views on Vision4Press platform.
Data correspond to usage on the plateform after 2015. The current usage metrics is available 48-96 hours after online publication and is updated daily on week days.
Initial download of the metrics may take a while.