Fig. 2
Download original image
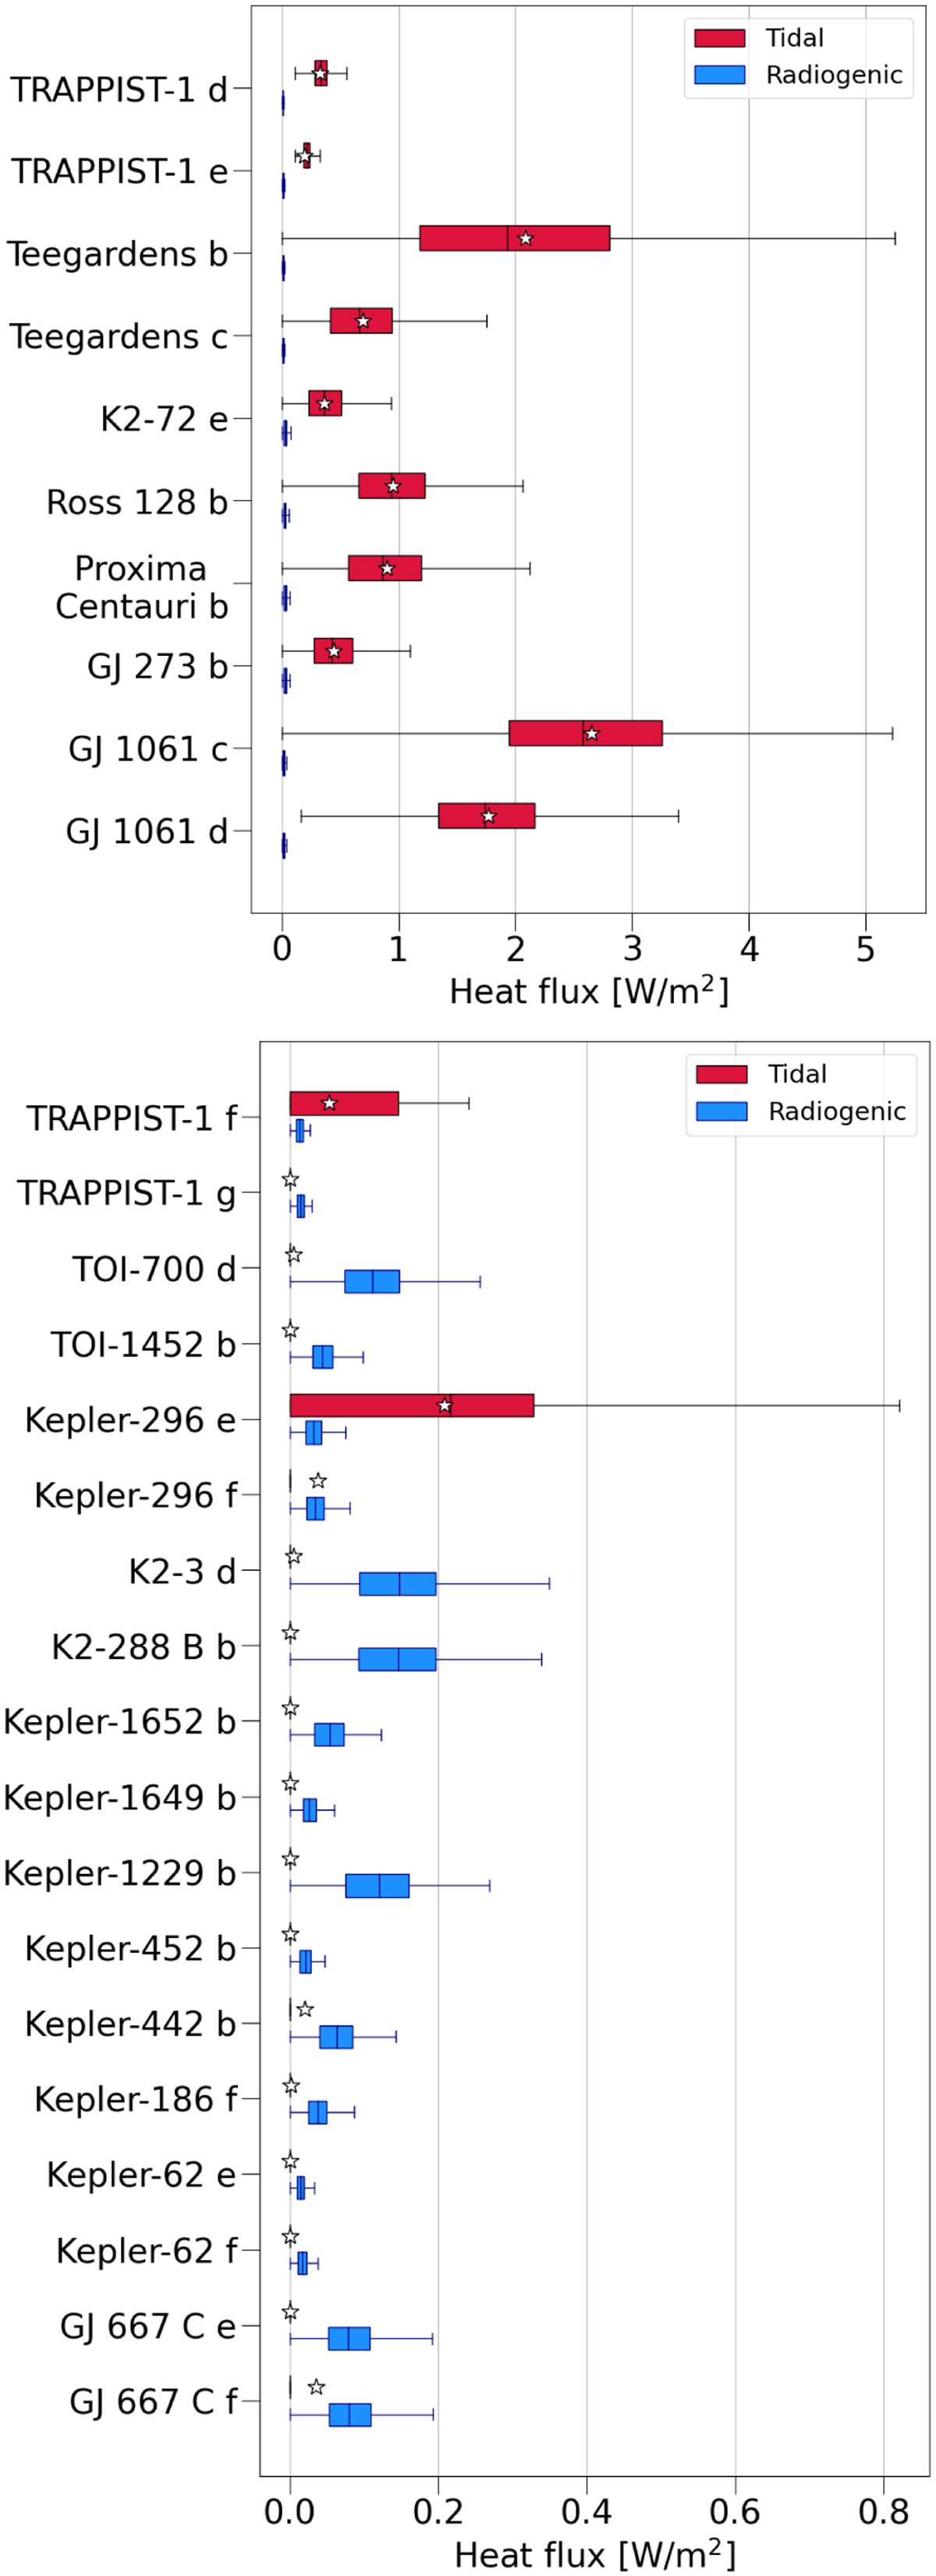
Contribution of the different heat sources to the internal heat flux at the rock-HPP boundary for each planet. The red boxes indicate tidal heating, while blue denotes radiogenic heat flux. Median values are represented as vertical lines inside the boxes. The upper and lower boundaries of the boxes correspond to the third and first quartiles (Q3 and Q1), respectively, while error bars show the maximum and minimum values. White stars indicate the average tidal heat flux values for every planet. We note the different scales in the two panels.
Current usage metrics show cumulative count of Article Views (full-text article views including HTML views, PDF and ePub downloads, according to the available data) and Abstracts Views on Vision4Press platform.
Data correspond to usage on the plateform after 2015. The current usage metrics is available 48-96 hours after online publication and is updated daily on week days.
Initial download of the metrics may take a while.