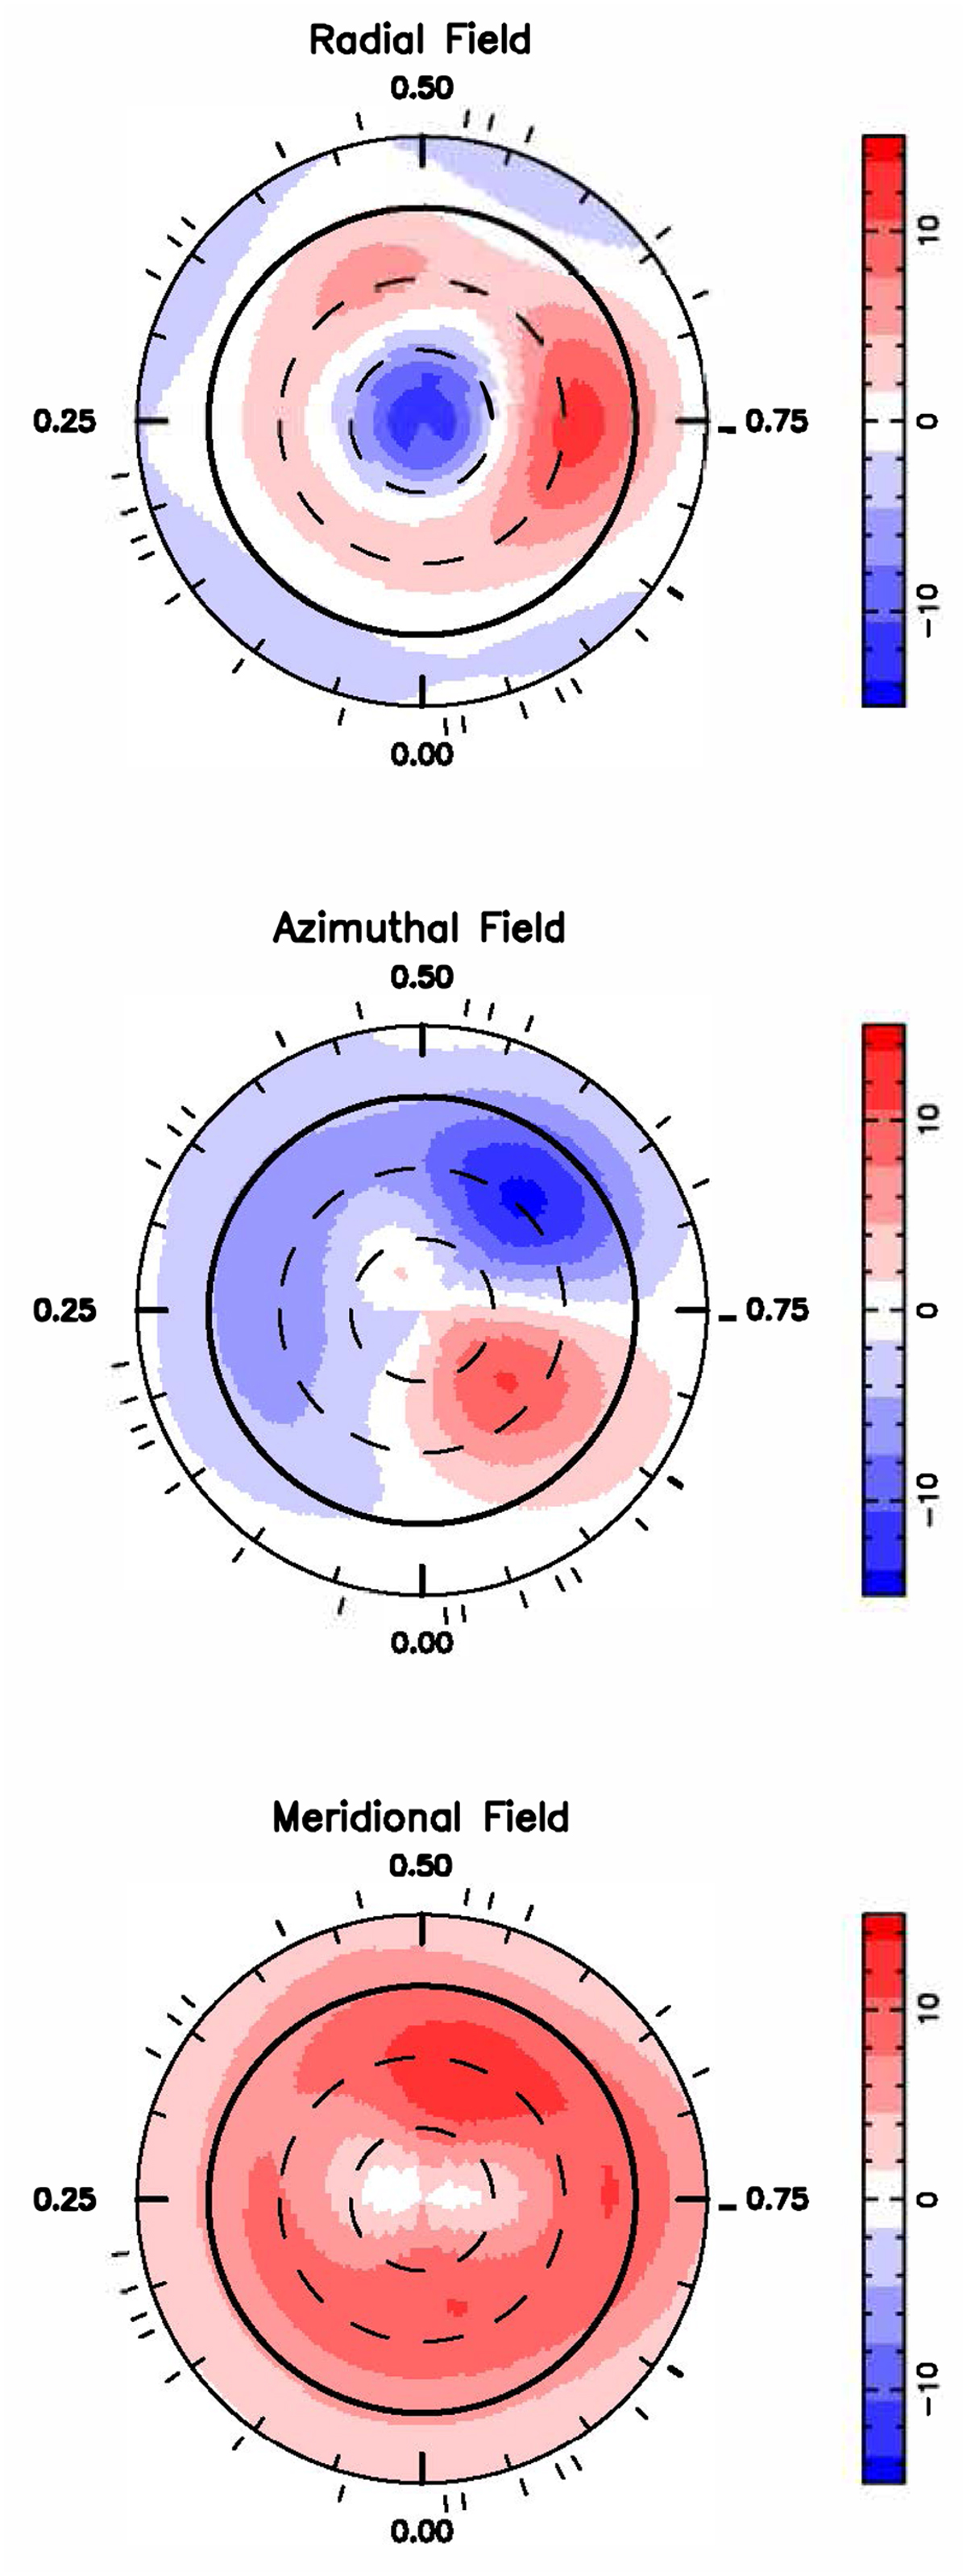
Fig. B.1
Download original image
Tentative surface magnetic map of RZ Ari reconstructed with ZDI; see section 4.2. The three components of the field in spherical coordinates are displayed from top to bottom (flux values are labeled in G). The star is shown in a flattened polar projection down to latitudes of −30°, with the equator depicted as a bold circle and parallels as dashed circles. The radial ticks around each plot indicate phases of observations. For this reconstruction, we used Prot = 530 d and an inclination of the rotation axis with respect to the line of sight i = 40°
Current usage metrics show cumulative count of Article Views (full-text article views including HTML views, PDF and ePub downloads, according to the available data) and Abstracts Views on Vision4Press platform.
Data correspond to usage on the plateform after 2015. The current usage metrics is available 48-96 hours after online publication and is updated daily on week days.
Initial download of the metrics may take a while.