Open Access
Fig. 4
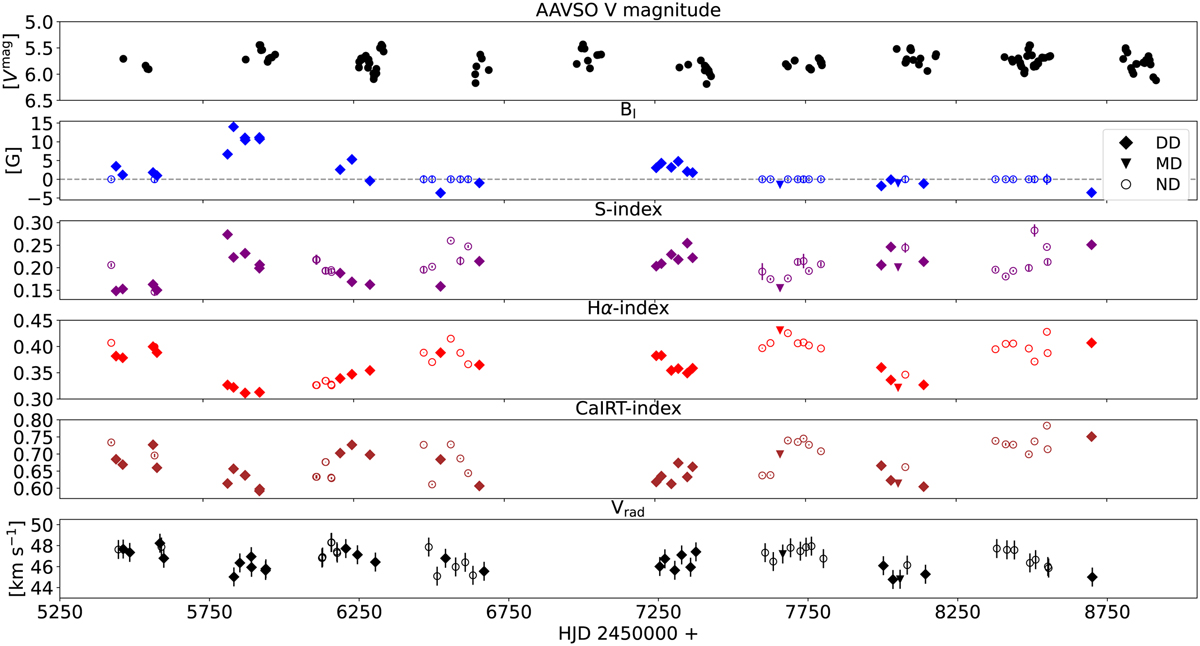
Download original image
From top to bottom: AAVSO light curve in the V band, longitudinal magnetic field (calculated with the full line mask), activity indicators, and υrad (calculated with the restricted line mask) variability in RZ Ari for the dates listed in Table 1. The magnetic field nondetections are designated with open symbols.
Current usage metrics show cumulative count of Article Views (full-text article views including HTML views, PDF and ePub downloads, according to the available data) and Abstracts Views on Vision4Press platform.
Data correspond to usage on the plateform after 2015. The current usage metrics is available 48-96 hours after online publication and is updated daily on week days.
Initial download of the metrics may take a while.