Fig. 2
Download original image
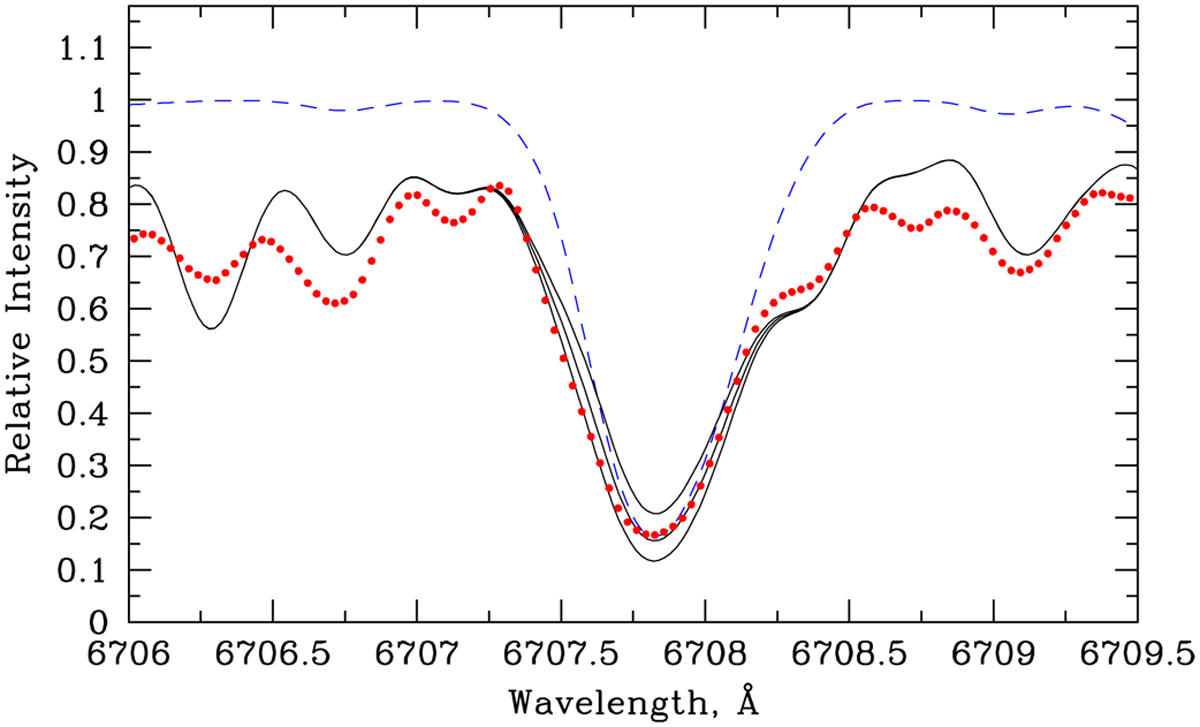
Observed (red dots) and synthetic (solid black lines) spectra of RZ Ari in the region around the Li I 6707.8 Å resonance line. The synthetic spectra were calculated with lithium abundances of log ɛ(Li) = 0.8, 1.2, and 1.6. The dotted blue line is the synthetic spectrum calculated without the contribution of the TiO molecular lines. The best fit is achieved for the log ɛ(Li) = 1.2 ± 0.2 dex.
Current usage metrics show cumulative count of Article Views (full-text article views including HTML views, PDF and ePub downloads, according to the available data) and Abstracts Views on Vision4Press platform.
Data correspond to usage on the plateform after 2015. The current usage metrics is available 48-96 hours after online publication and is updated daily on week days.
Initial download of the metrics may take a while.