Fig. B.2
Download original image
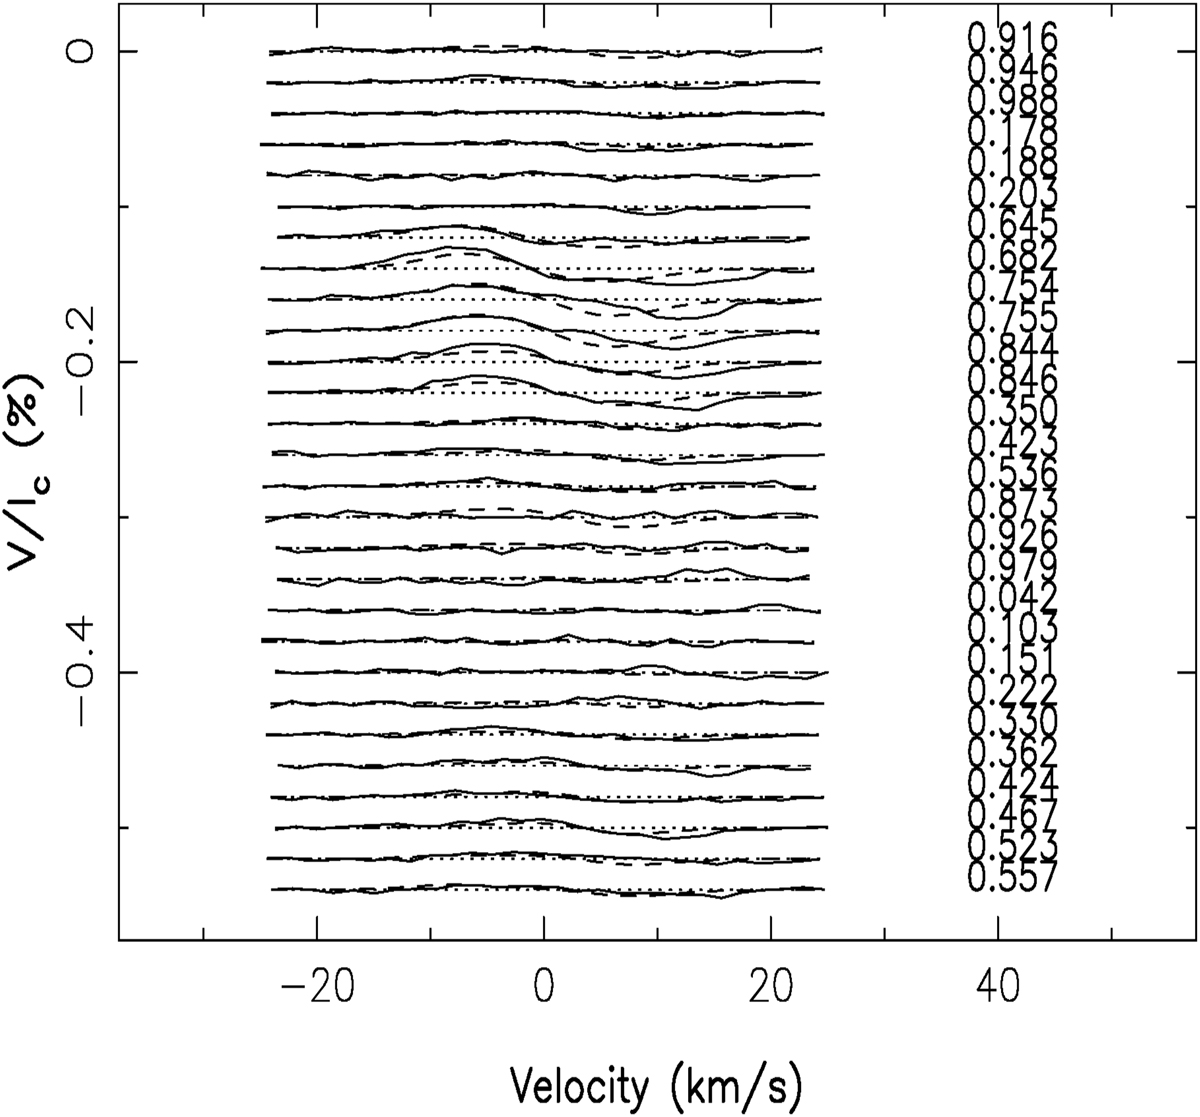
Fit to the Stokes V LSD time series corresponding to the ZDI map of figure B.1. Synthetic profiles corresponding to our magnetic models (dashed lines) are superimposed on the observed LSD profiles (solid lines). The fractional rotational phases of each observation are also mentioned at right-hand side of each profile. The successive profiles are shifted vertically for clarity purposes, and the associated reference levels (V = 0) are plotted as dotted lines.
Current usage metrics show cumulative count of Article Views (full-text article views including HTML views, PDF and ePub downloads, according to the available data) and Abstracts Views on Vision4Press platform.
Data correspond to usage on the plateform after 2015. The current usage metrics is available 48-96 hours after online publication and is updated daily on week days.
Initial download of the metrics may take a while.