Fig. 3
Download original image
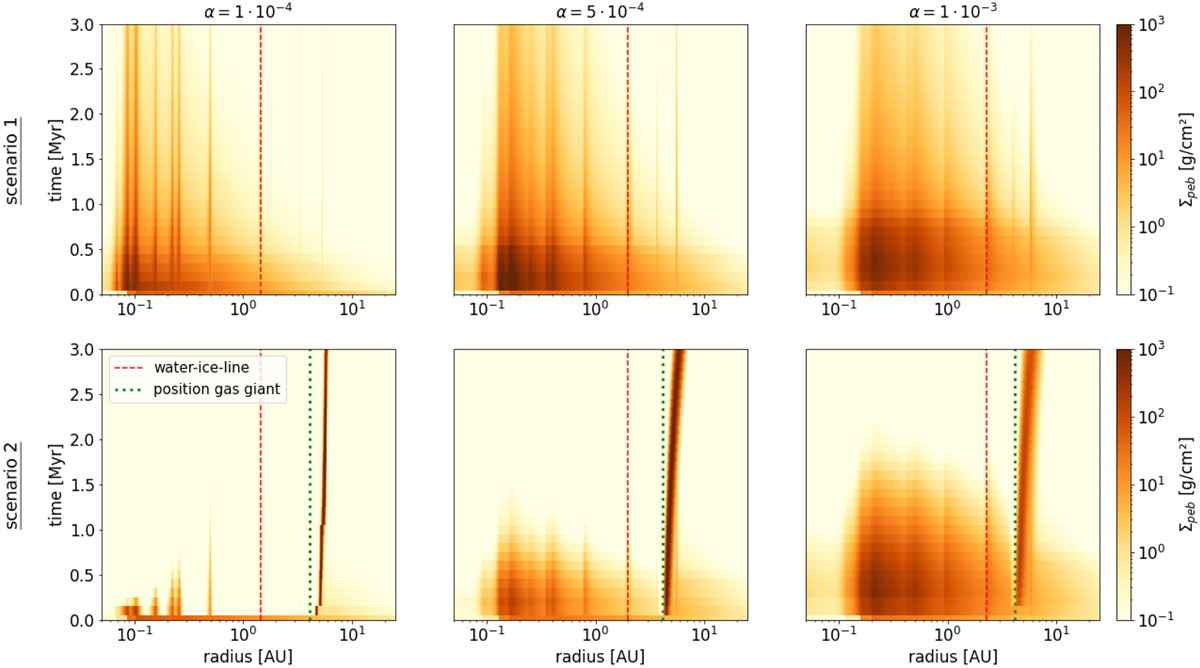
Pebble surface density for scenario 1 (top) and scenario 2 (bottom) for different α-viscosities, as a function of disk radius and time. In each case, the red vertical line denotes the water-ice line, and the green line marks the position of the gas giant, if present. In the scenario with a gas giant, the accumulation of blocked pebbles exterior to the gas giant’s position is visible. Further accumulations within the water-ice line result from the recondensation of outwardly diffusing gas at different evaporation lines.
Current usage metrics show cumulative count of Article Views (full-text article views including HTML views, PDF and ePub downloads, according to the available data) and Abstracts Views on Vision4Press platform.
Data correspond to usage on the plateform after 2015. The current usage metrics is available 48-96 hours after online publication and is updated daily on week days.
Initial download of the metrics may take a while.