Fig. 2

Download original image
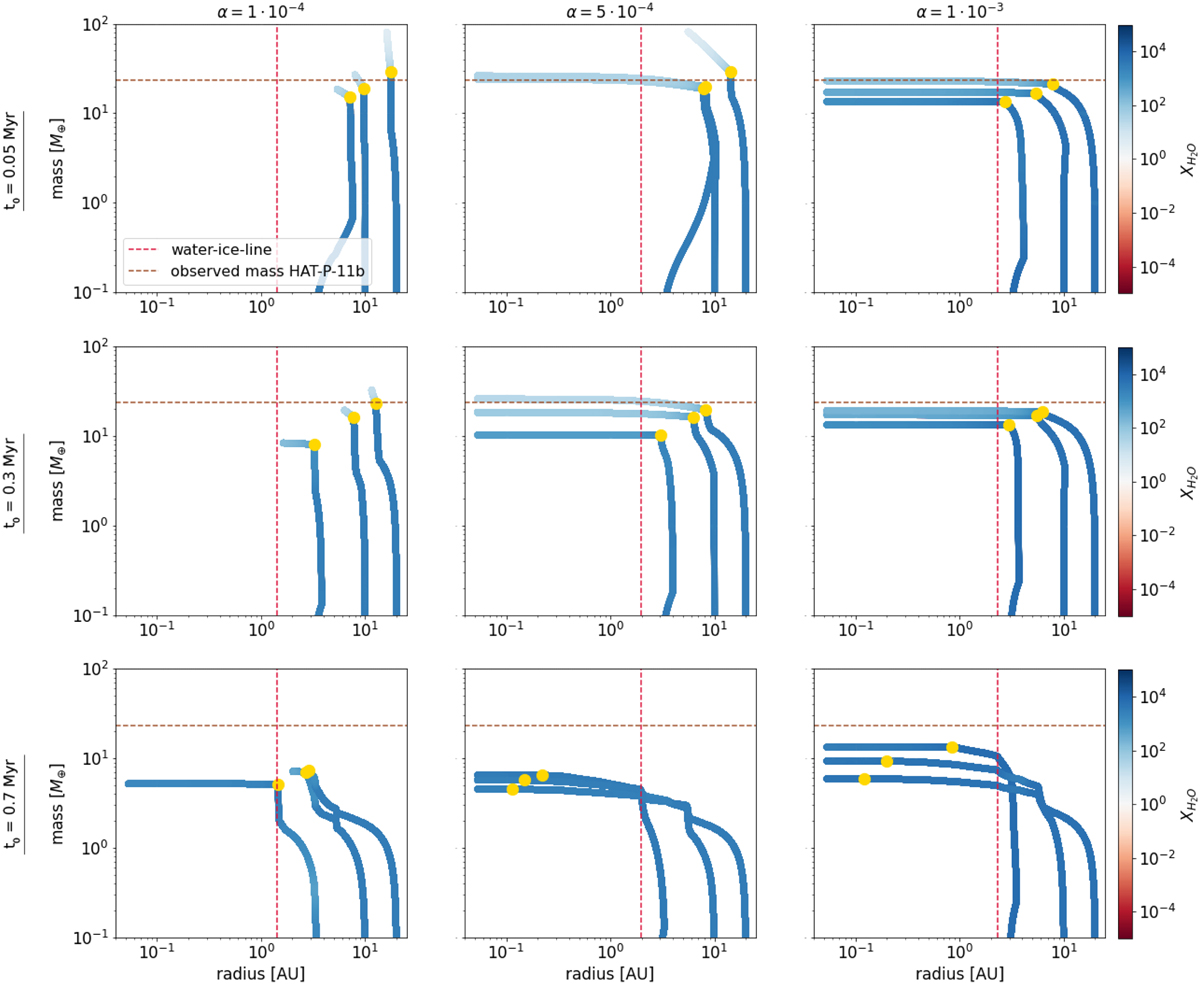
Growth track of the inner planet for different insertion times (0.05 Myr, 0.3 Myr, 0.7 Myr, top to bottom), initial positions (3 AU, 10 AU, 20 AU), and α-viscosities (α = 1 × 10⁻⁴, 5 × 10⁻⁴, 1 × 10⁻³, left to right) as a function of the position of the planet in the disk and its total mass. The color code represents the water content of the planetary envelope normalized to stellar composition. The yellow dot indicates the onset of gas accretion, the red vertical line marks the water-ice line, and the orange horizontal line indicates observed mass of HAT-P-11b, namely 23.4M⊕. Each simulation results in superstellar water content for the planetary envelope, contrary to the strongly substellar water content of HAT-P-11b.
Current usage metrics show cumulative count of Article Views (full-text article views including HTML views, PDF and ePub downloads, according to the available data) and Abstracts Views on Vision4Press platform.
Data correspond to usage on the plateform after 2015. The current usage metrics is available 48-96 hours after online publication and is updated daily on week days.
Initial download of the metrics may take a while.


