Fig. 1
Download original image
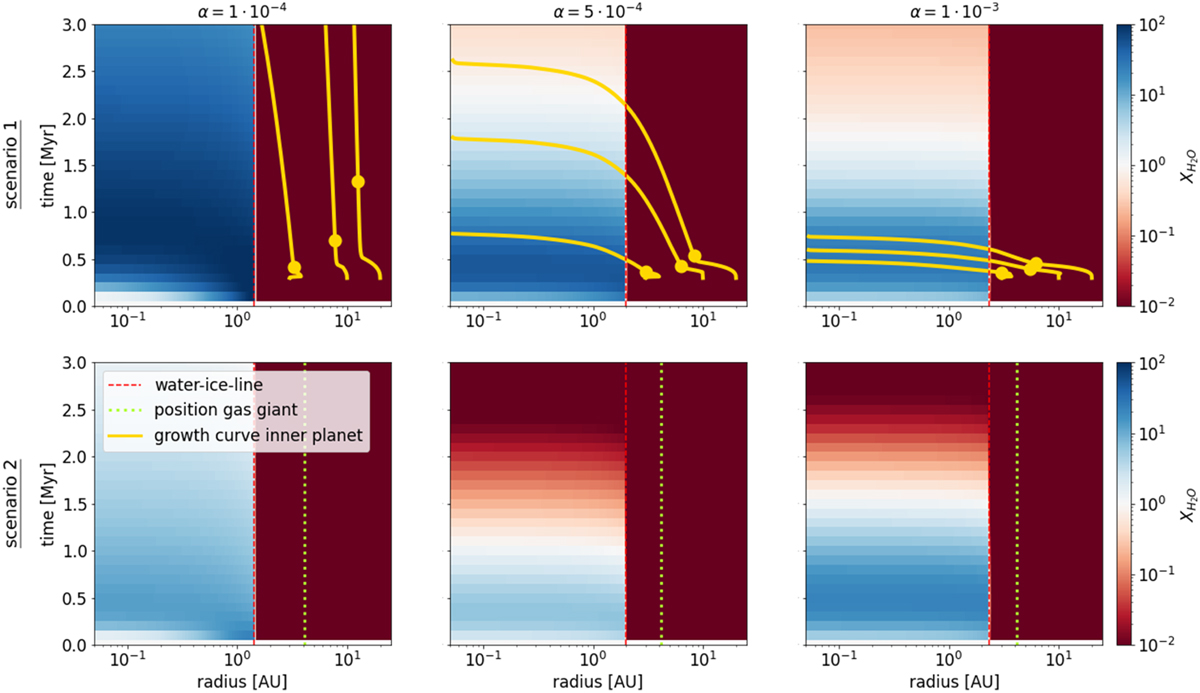
Water content in the gas phase within the water-ice line as a function of disk radius and time, normalized to stellar composition. Results for different α-viscosities for scenario 1 (top) and scenario 2 (bottom) are displayed. Blue regions indicate superstellar water content, while red regions indicate substellar water content. Beyond the water-ice line (marked with a red vertical line), water exists only as ice, resulting in zero water vapor abundance exterior to the ice line. For scenario 1, we additionally show the growth tracks of the planets inserted at 0.3 Myr, where the yellow dot indicates the time when the planet reaches pebble isolation mass and enters the gas-accretion phase. For scenario 2 (bottom), the position of the gas giant is marked with a green vertical line.
Current usage metrics show cumulative count of Article Views (full-text article views including HTML views, PDF and ePub downloads, according to the available data) and Abstracts Views on Vision4Press platform.
Data correspond to usage on the plateform after 2015. The current usage metrics is available 48-96 hours after online publication and is updated daily on week days.
Initial download of the metrics may take a while.