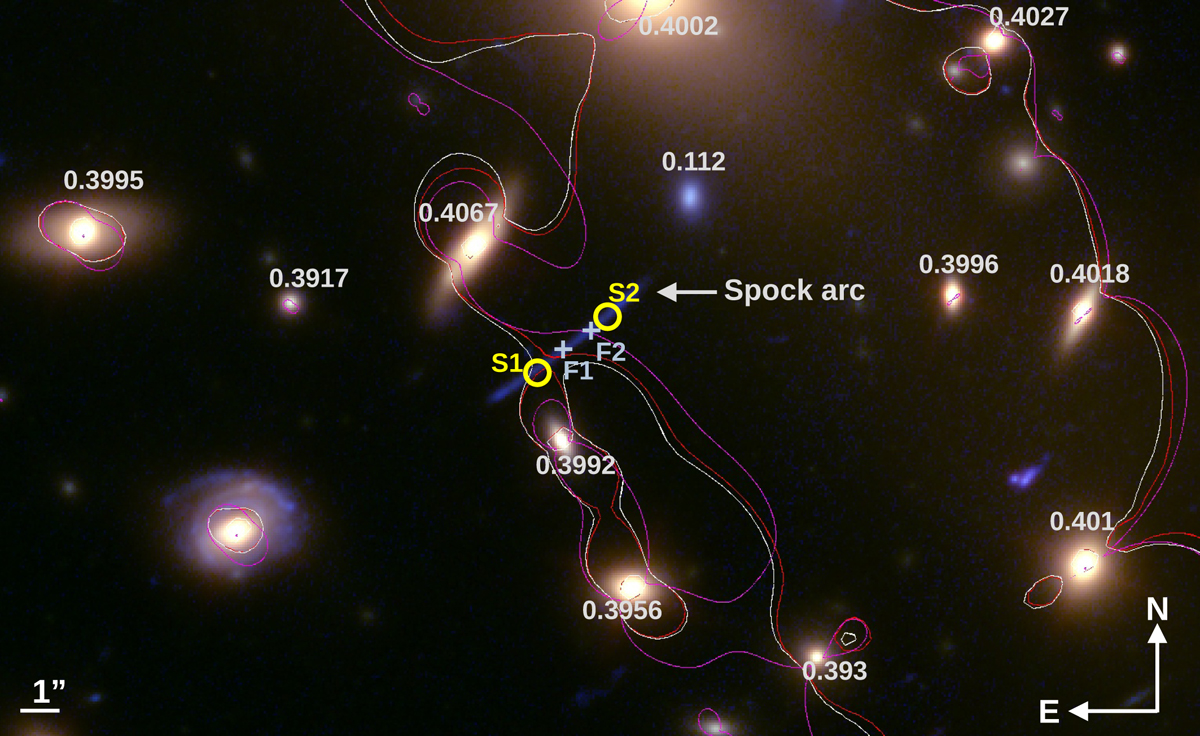
Fig. 7.
Download original image
Spock arc. The radial arc at z = 1.0054 shows the location of the two Spock transients (S1 and S2 in yellow circles) reported by Rodney et al. (2018). Two additional transients are also marked with light-blue crosses (F1 and F2). These were discovered in the same arc as part of the Flashlights program (Kelly et al. 2022). Redshifts of nearby galaxies are indicated in light gray. The white line is the critical curve at z = 1.0054 assuming the cluster is at z = 0.396. The red curve assumes the cluster is at a slightly larger redshift of 0.4 and consistent with these nearby galaxies. The magenta line is the zs = 1.0054 critical curve predicted by the model of Bergamini et al. (2023).
Current usage metrics show cumulative count of Article Views (full-text article views including HTML views, PDF and ePub downloads, according to the available data) and Abstracts Views on Vision4Press platform.
Data correspond to usage on the plateform after 2015. The current usage metrics is available 48-96 hours after online publication and is updated daily on week days.
Initial download of the metrics may take a while.