Fig. 6.
Download original image
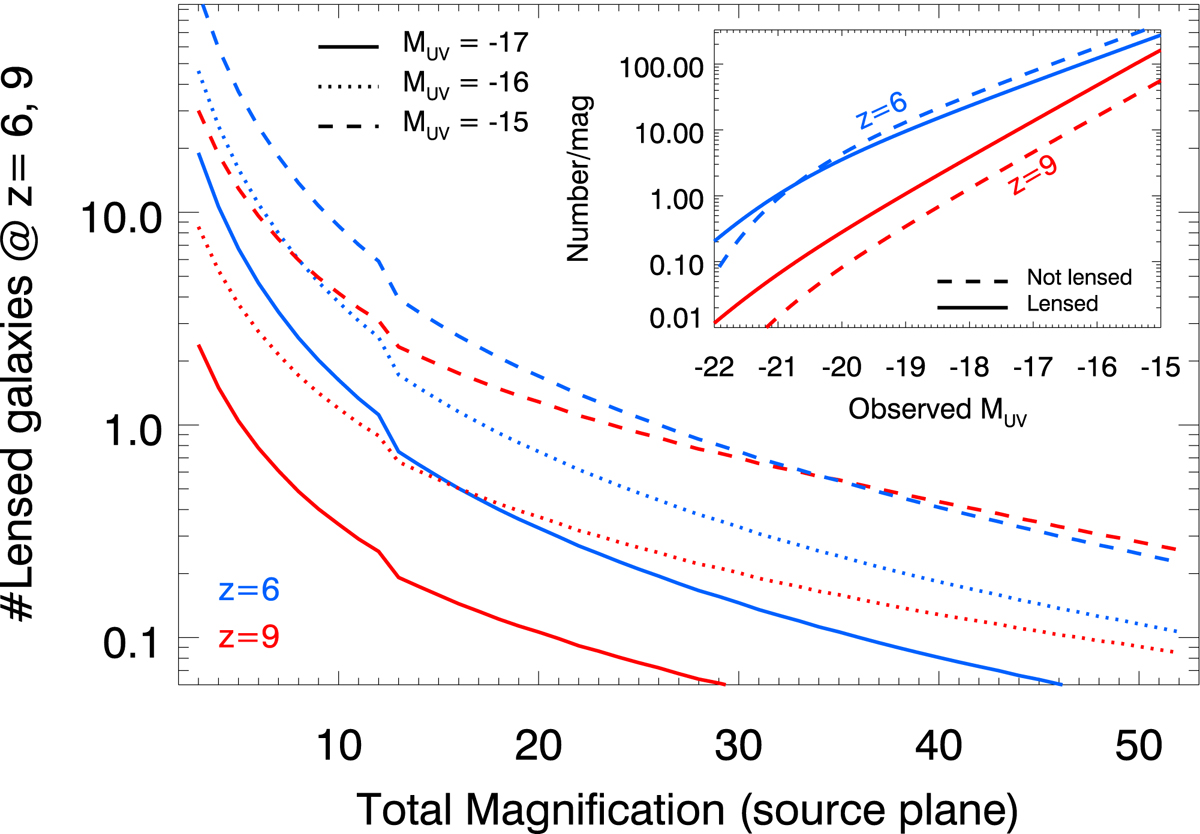
Expected number of lensed galaxies in MACS0416. The larger plot shows the number of lensed galaxies behind MACS0416 at z = 6 (blue curves) and z = 9 (red curves), as a function of magnification (larger plot) or observed absolute magnitude (smaller plot). We assumed a standard luminosity function at each redshift. The different lines are for different limiting magnitudes: −17 (solid lines), −16 (dotted lines), or −15 (dashed lines). In the smaller plot the solid lines are the number of lensed galaxies for each observed magnitude, while the dashed lines are the number of galaxies one would have observed in the same magnitude bins but without lensing magnification.
Current usage metrics show cumulative count of Article Views (full-text article views including HTML views, PDF and ePub downloads, according to the available data) and Abstracts Views on Vision4Press platform.
Data correspond to usage on the plateform after 2015. The current usage metrics is available 48-96 hours after online publication and is updated daily on week days.
Initial download of the metrics may take a while.