Fig. 5.
Download original image
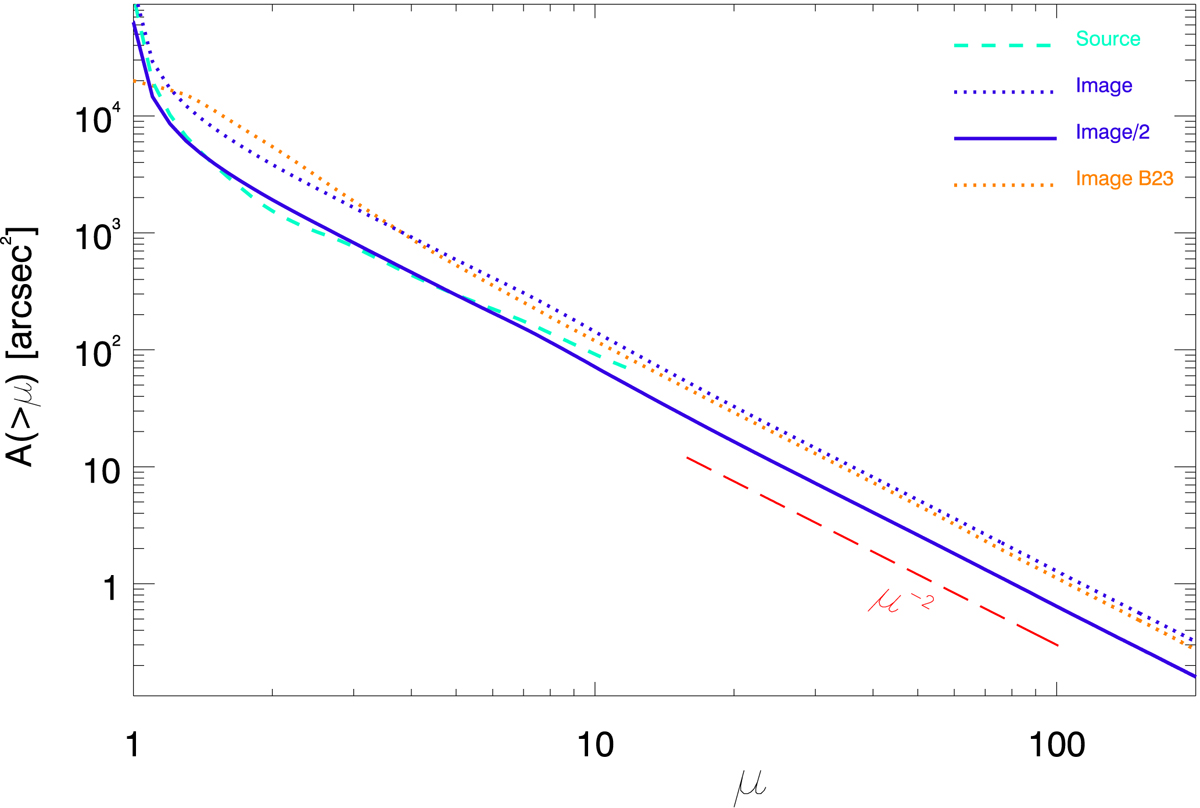
Area above magnification μ at z = 9. The dashed line is computed in the source plane from the caustic map. The dotted line is the area computed in the image plane from the magnification map corrected by the factor μ. The solid line is similar to the dotted line but divided by a factor of 2 (in order to account for the contribution from the double image at large magnification factors). At large magnification factors, the solid curve falls as the expected μ−2 power law. For comparison, we show as an orange dotted line the same lensing probability for the model of Bergamini et al. (2023) at z = 9.
Current usage metrics show cumulative count of Article Views (full-text article views including HTML views, PDF and ePub downloads, according to the available data) and Abstracts Views on Vision4Press platform.
Data correspond to usage on the plateform after 2015. The current usage metrics is available 48-96 hours after online publication and is updated daily on week days.
Initial download of the metrics may take a while.