Fig. 4.
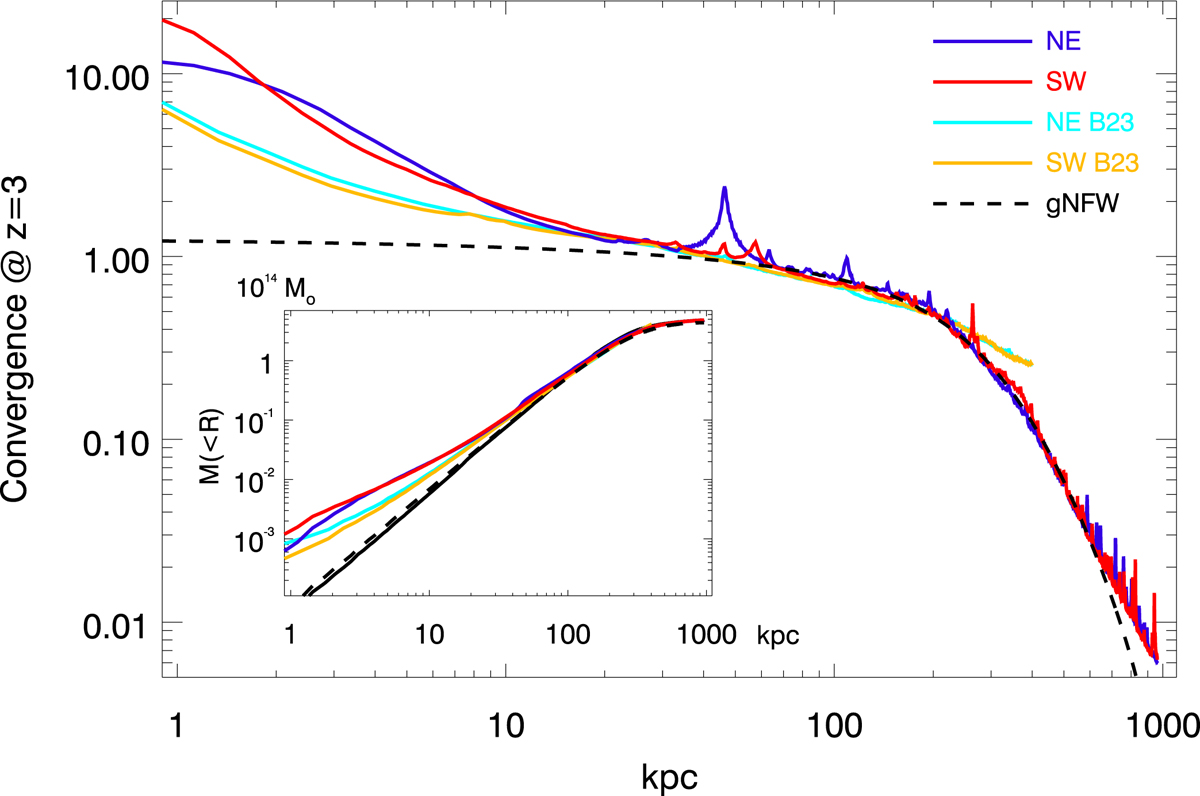
Download original image
Mass profile of the lens model. The blue and red solid curves show the profiles when adopting the NE and SW BCGs as central points, respectively. The mass profiles are given in dimensionless κ units assuming a source at z = 3. The dashed line is a gNFW profile with parameters γ = 0.5, α = 2.5, β = 3, and scale radius rs = 80 kpc. The inset shows the integrated mass as a function of radius in units of 1014 M⊙, and for the same three profiles shown in the larger plot. The black dashed line is the integrated profile when the center is chosen as the middle point between the two BCG galaxies (RA = 4h16m08.428s, Dec = −24° 04′21.0″). For comparison, we show as light blue and orange the profiles from Bergamini et al. (2023).
Current usage metrics show cumulative count of Article Views (full-text article views including HTML views, PDF and ePub downloads, according to the available data) and Abstracts Views on Vision4Press platform.
Data correspond to usage on the plateform after 2015. The current usage metrics is available 48-96 hours after online publication and is updated daily on week days.
Initial download of the metrics may take a while.