Fig. 3.
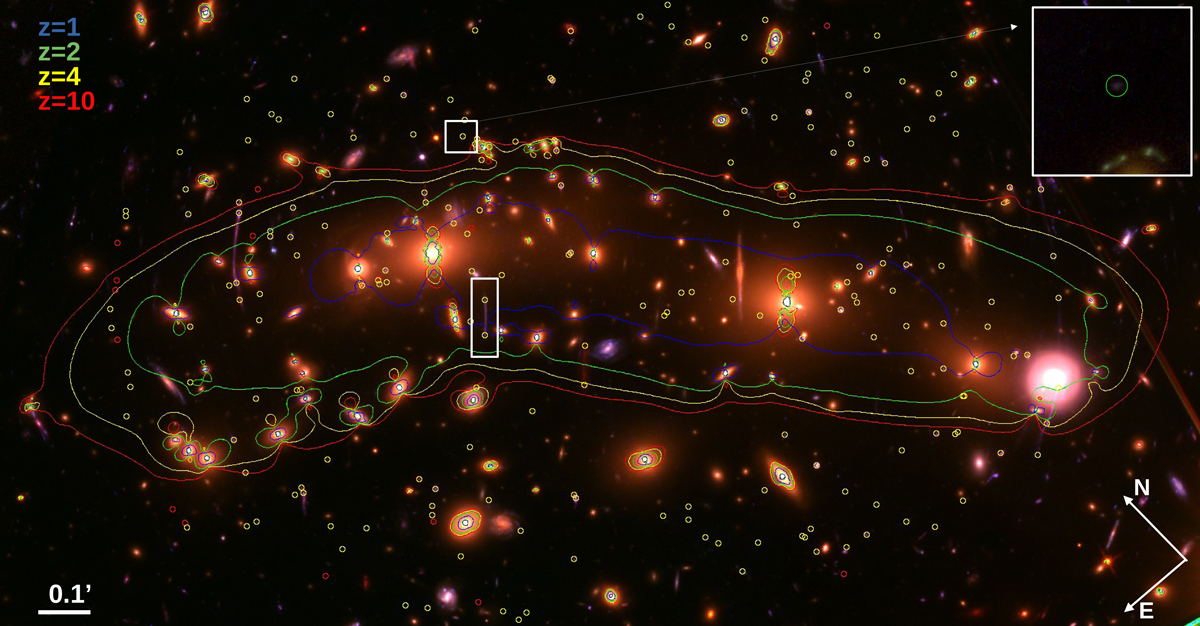
Download original image
Central region with arc positions. Yellow circles are the 72 systems identified in BUFFALO data and with spectroscopic redshifts. Red circles are systems not included in the previous sample but listed by Bergamini et al. (2023). The critical curves for different redshifts are shown (z = 1, 2, 4, and 10; blue, green, yellow, and red, respectively). This image is a composite made with the seven HST filters (F435W, F606W, F814W, F105W, F125W, F140W, and F160W). The white rectangle marks the position of the Spock arc. The small white square marks the position of the third counterimage of the Spock arc. A zoomed-in version is shown at top right, where the counterimage is contained within the yellow circle. The radius of this circles is 0.25″.
Current usage metrics show cumulative count of Article Views (full-text article views including HTML views, PDF and ePub downloads, according to the available data) and Abstracts Views on Vision4Press platform.
Data correspond to usage on the plateform after 2015. The current usage metrics is available 48-96 hours after online publication and is updated daily on week days.
Initial download of the metrics may take a while.