Fig. 2.
Download original image
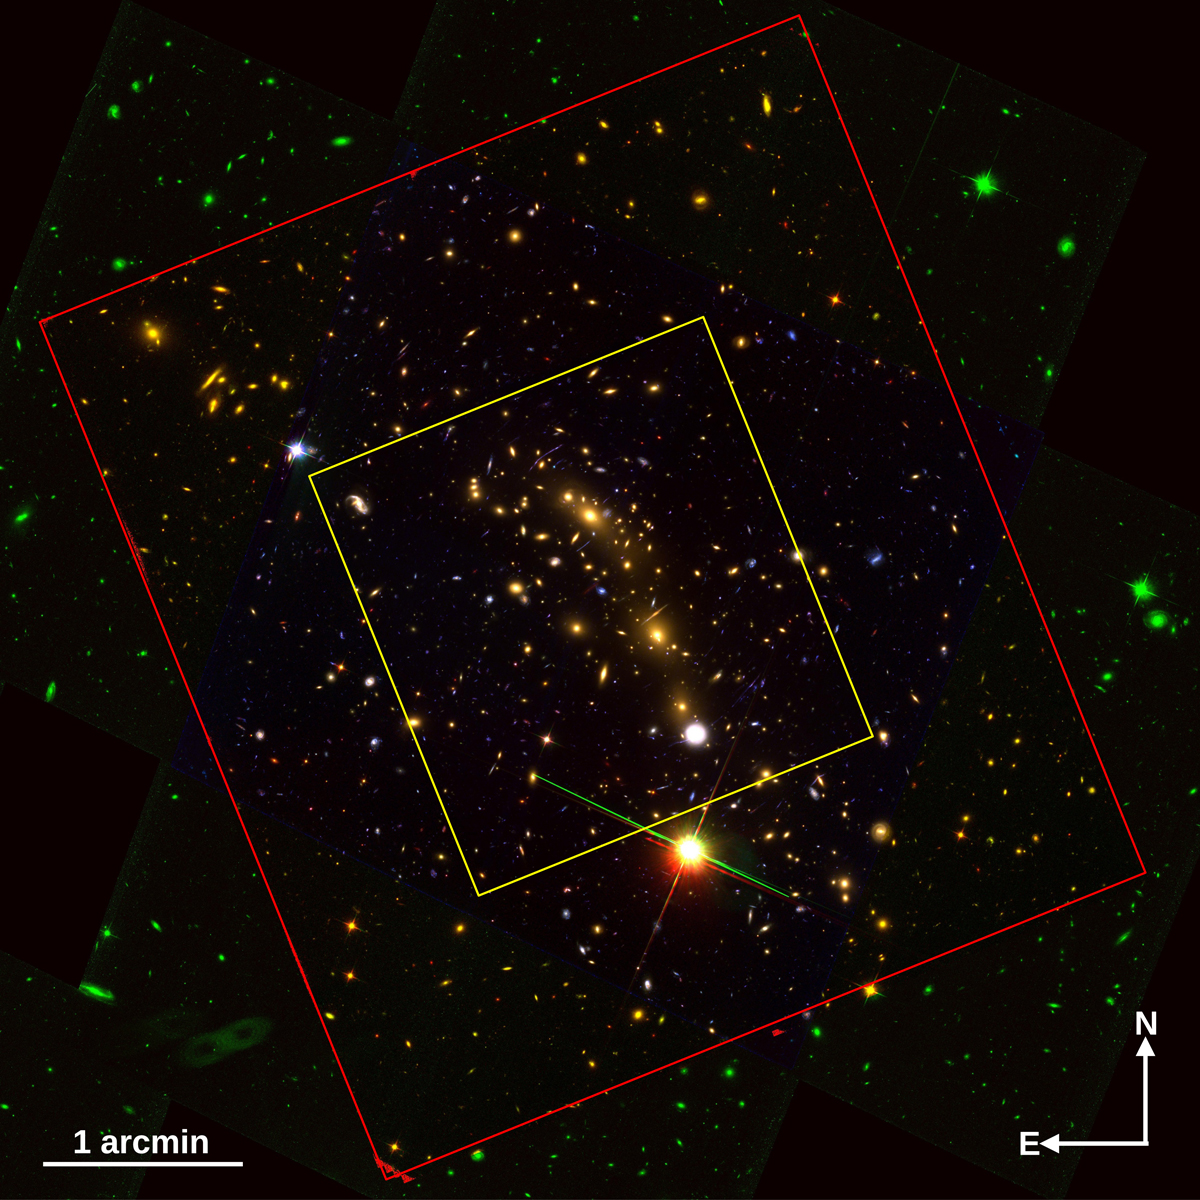
BUFFALO data around the cluster. The image shown is 6 arcmin on a side. The yellow rectangle marks the region where previous IR data from the HFF program were taken. The red rectangle shows the expanded area covered by BUFFALO in the IR filters. This image corresponds to the combination of filters F435W, F814W, and F160W. Strong-lensing constraints are present only in the central region (yellow square) while weak-lensing constraints are spread over the entire image.
Current usage metrics show cumulative count of Article Views (full-text article views including HTML views, PDF and ePub downloads, according to the available data) and Abstracts Views on Vision4Press platform.
Data correspond to usage on the plateform after 2015. The current usage metrics is available 48-96 hours after online publication and is updated daily on week days.
Initial download of the metrics may take a while.