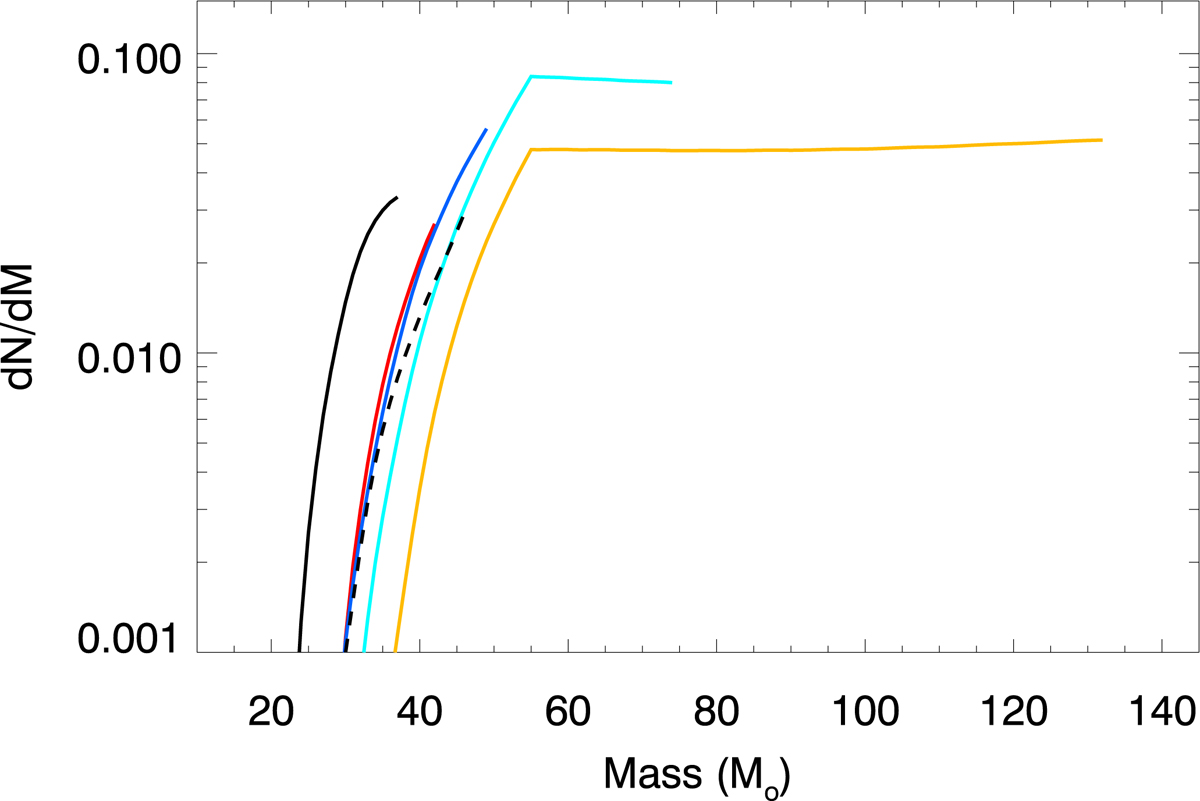
Fig. 14.
Download original image
Number of stars detected per mass interval as a function of distance to the critical curve (or magnification) in filter F200LP at depth 29 mag (Flashlights). All stars are assumed to have the same temperature T = 10 000 K. The colors and styles of the lines are the same as in previous figures (yellow for the farthest distance to the caustic and black for the closest one).
Current usage metrics show cumulative count of Article Views (full-text article views including HTML views, PDF and ePub downloads, according to the available data) and Abstracts Views on Vision4Press platform.
Data correspond to usage on the plateform after 2015. The current usage metrics is available 48-96 hours after online publication and is updated daily on week days.
Initial download of the metrics may take a while.