Fig. 12.
Download original image
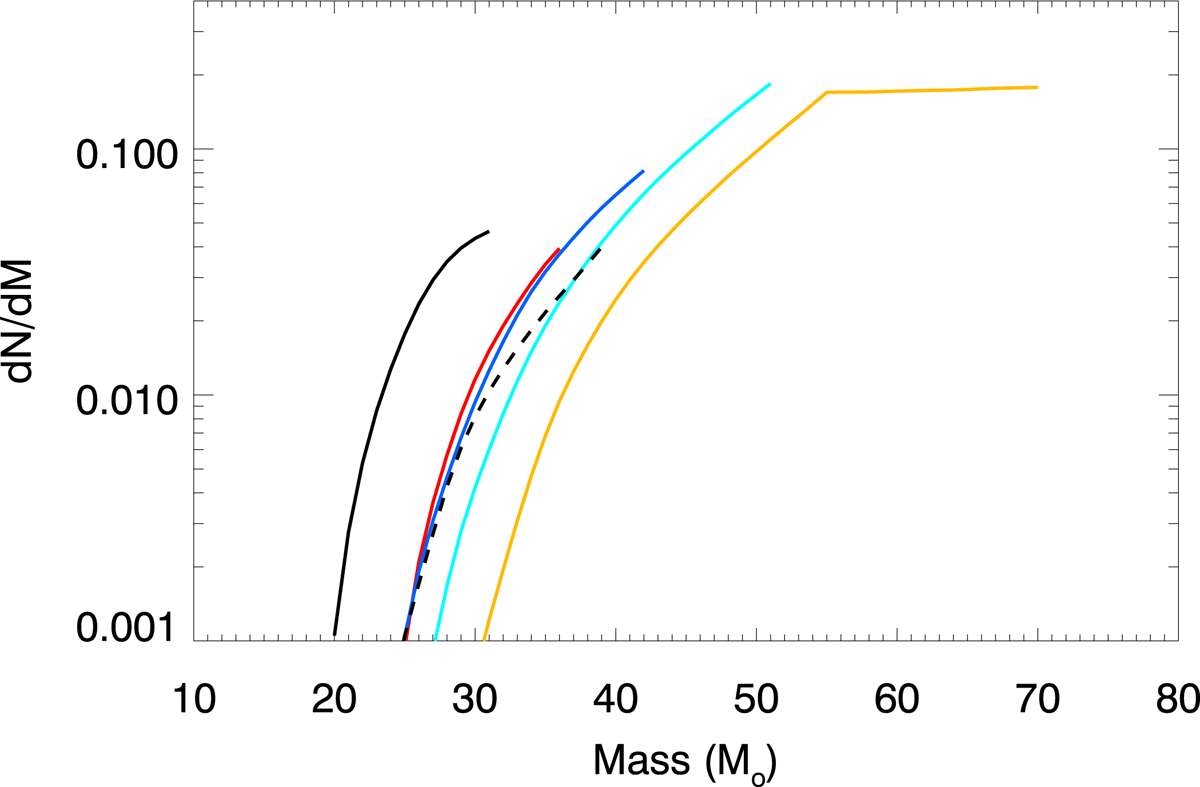
Mass dependence vs. distance in HST’s F814W filter at depth 28.5 mag. This figure is the differential version of Fig. 11. The colors and linestyles of the curves have the same interpretation as in the previous figure (that is, yellow is for the farthest distance to the caustic and black for the closest). The dashed line again represents the case where Σ* = 5 M⊙ pc−2 as in Fig. 11. The plateau in the yellow curve marks the transition in the M–L relation at M ≈ 55 M⊙.
Current usage metrics show cumulative count of Article Views (full-text article views including HTML views, PDF and ePub downloads, according to the available data) and Abstracts Views on Vision4Press platform.
Data correspond to usage on the plateform after 2015. The current usage metrics is available 48-96 hours after online publication and is updated daily on week days.
Initial download of the metrics may take a while.