Fig. 11.
Download original image
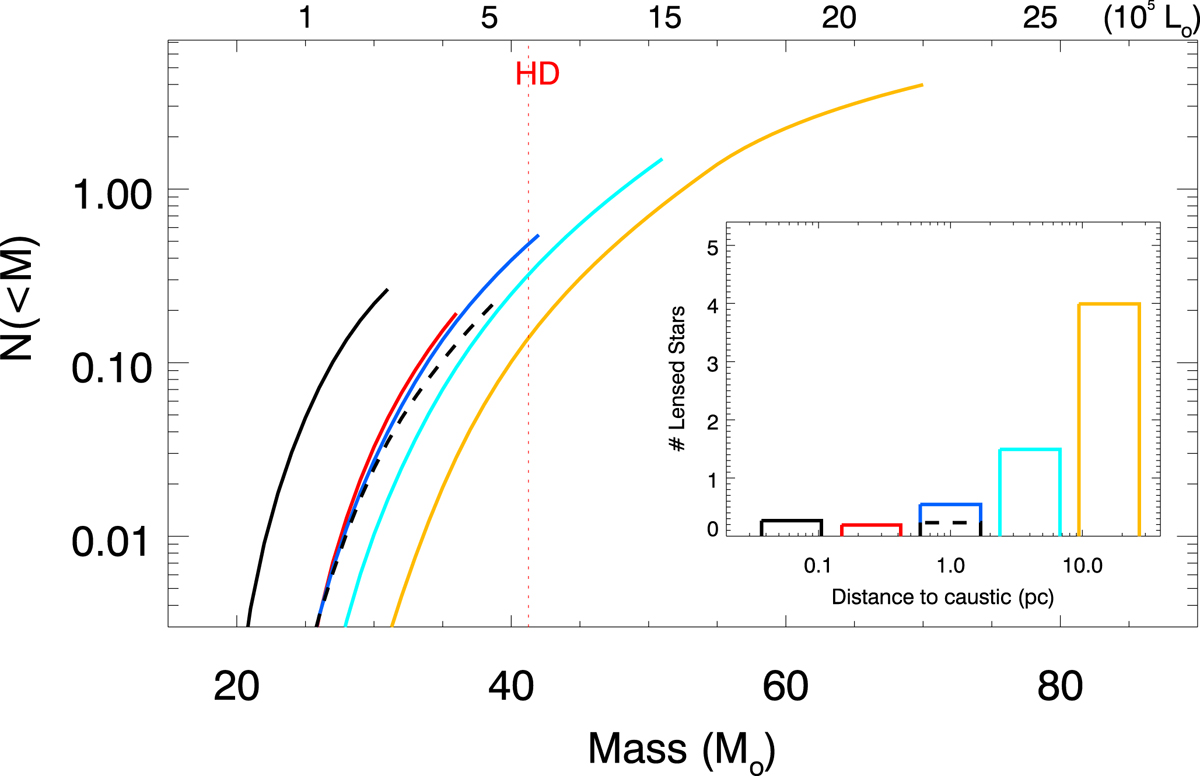
Number of stars vs. distance. The large plot shows the cumulative number of stars observed at different distances from the caustic, as a function of the star mass. In this and other plots, the mass has to be interpreted as the equivalent mass of a MS star with the same luminosity. SG stars normally have smaller masses than its equivalent MS star. We assume observations reach a limiting magnitude of 28.5 in HST’s F814W filter. Stars from the MS with equivalent masses below ∼20 M⊙ are too faint to be detected, even at the largest magnification factors considered here. Each curve stops when Lmax is reached. The total number of stars expected at each distance is shown in the inset at the bottom right. Each bin in the inset is centered at a given magnification (or distance to the caustic) and the width is computed from the ![]() relation taking 30% above and 30% below the magnification of the bin. colors in the inset correspond to colors in the larger plot. In all cases except for the dashed curve, the assumed surface mass density of microlenses is Σ∗ = 20 M⊙ pc−2, and all stars are assumed to have the same temperature of 10 000 K. The dashed curve corresponds to separations of ∼1 pc from the caustic, but for a surface mass density of microlenses of Σ∗ = 5 M⊙ pc−2. The maximum probability of seeing a lensed star is found at ∼16 pc from the caustic (yellow bin), if one ignores the Humphreys-Davidson (HD) limit (vertical dotted line). If one considers this limit, the most likely distance to observe stars is at 1 pc (dark blue bin corresponding to total magnification μ ≈ 270, or μ = 135 for each counterimage), in good agreement with the observations and lens model.
relation taking 30% above and 30% below the magnification of the bin. colors in the inset correspond to colors in the larger plot. In all cases except for the dashed curve, the assumed surface mass density of microlenses is Σ∗ = 20 M⊙ pc−2, and all stars are assumed to have the same temperature of 10 000 K. The dashed curve corresponds to separations of ∼1 pc from the caustic, but for a surface mass density of microlenses of Σ∗ = 5 M⊙ pc−2. The maximum probability of seeing a lensed star is found at ∼16 pc from the caustic (yellow bin), if one ignores the Humphreys-Davidson (HD) limit (vertical dotted line). If one considers this limit, the most likely distance to observe stars is at 1 pc (dark blue bin corresponding to total magnification μ ≈ 270, or μ = 135 for each counterimage), in good agreement with the observations and lens model.
Current usage metrics show cumulative count of Article Views (full-text article views including HTML views, PDF and ePub downloads, according to the available data) and Abstracts Views on Vision4Press platform.
Data correspond to usage on the plateform after 2015. The current usage metrics is available 48-96 hours after online publication and is updated daily on week days.
Initial download of the metrics may take a while.