Fig. 1.
Download original image
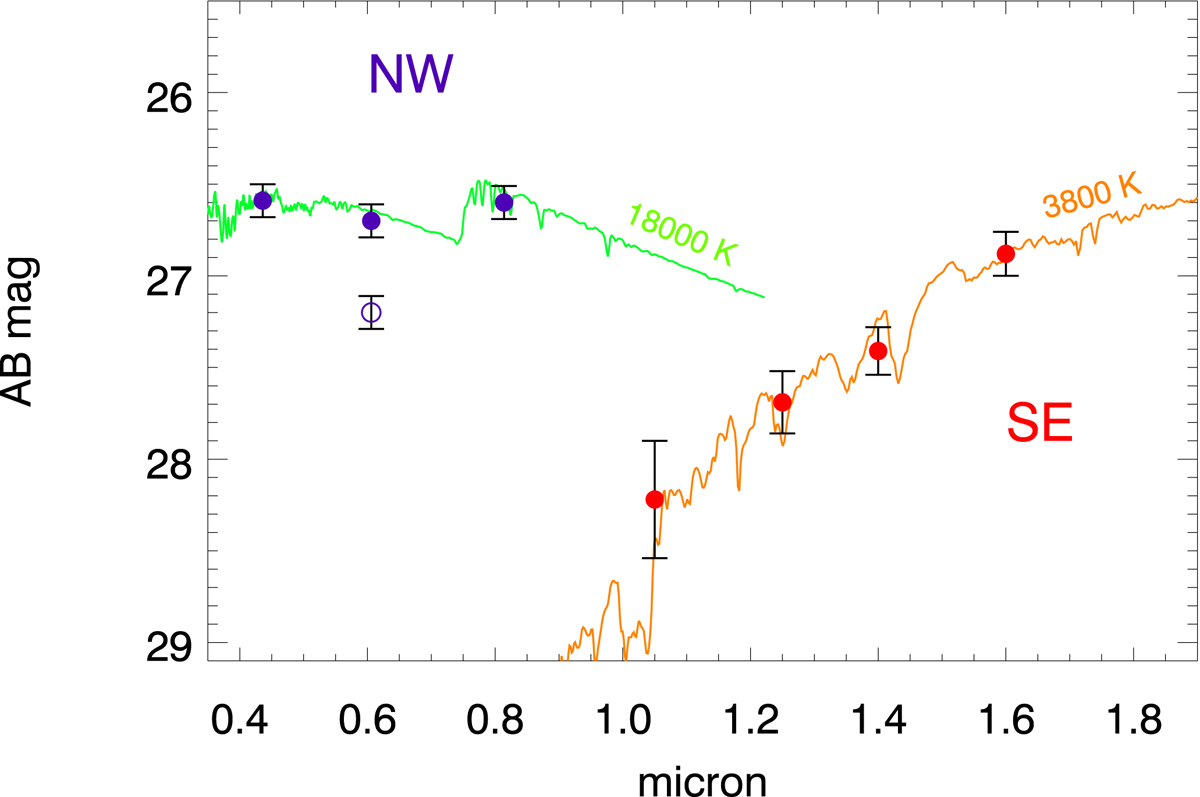
Photometry of the two events (SE and NW) in the Spock galaxy reported by Rodney et al. (2018) vs. stellar models. For each event, the magnitudes in this plot correspond to the moment of maximum observed luminosity in Rodney et al. (2018) and are obtained from that work. The colored curves are synthetic models from Coelho (2014) for different star temperatures. The SE event is well described by a red SG with T ≈ 3800 K, while the NW event is better described by a hotter star system with temperature T ≈ 18 000 K. Blue dots correspond to the optical bands while red dots are for the IR channels. The open circle is the magnitude measured in F606W 1 day (a half day in the rest frame) before maximum. We corrected this magnitude by 0.5 mag from the relation dm/dt ≈ 1 mag day−1 found in Rodney et al. (2018) where time is expressed in the rest frame of the Spock galaxy (see their Supplementary Fig. 9).
Current usage metrics show cumulative count of Article Views (full-text article views including HTML views, PDF and ePub downloads, according to the available data) and Abstracts Views on Vision4Press platform.
Data correspond to usage on the plateform after 2015. The current usage metrics is available 48-96 hours after online publication and is updated daily on week days.
Initial download of the metrics may take a while.