Fig. 9
Download original image
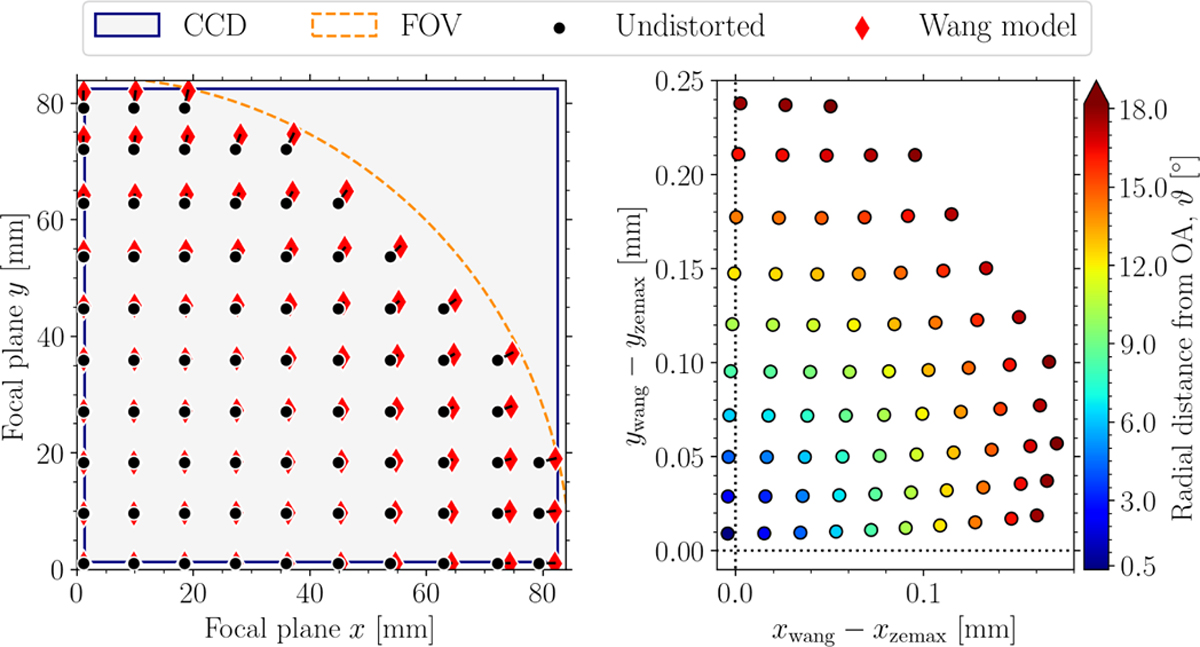
Illustration of the field distortion models. Left: Distortion over one quadrant of the FPA with a grid step size of 2°. Shown are the undistorted paraxial chief ray coordinates (black dots) and the real (distorted) chief ray coordinates calculated by the Wang et al. (2008) distortion model (red diamonds), together with the CCD area (dark grey area enclosed by dark blue lines) and the effective size of the camera FOV (dashed orange line). Right: Residuals between the Wang and the Zemax distortion model evaluated in the FPA grid points shown in the left panel. The colour bar serves as a reference of the radial distance to the optical axis, ϑ. We note that with a PLATO plate scale of 18 µm a residual of 0.1 mm corresponds to ~5.6 pixel.
Current usage metrics show cumulative count of Article Views (full-text article views including HTML views, PDF and ePub downloads, according to the available data) and Abstracts Views on Vision4Press platform.
Data correspond to usage on the plateform after 2015. The current usage metrics is available 48-96 hours after online publication and is updated daily on week days.
Initial download of the metrics may take a while.