Fig. 7
Download original image
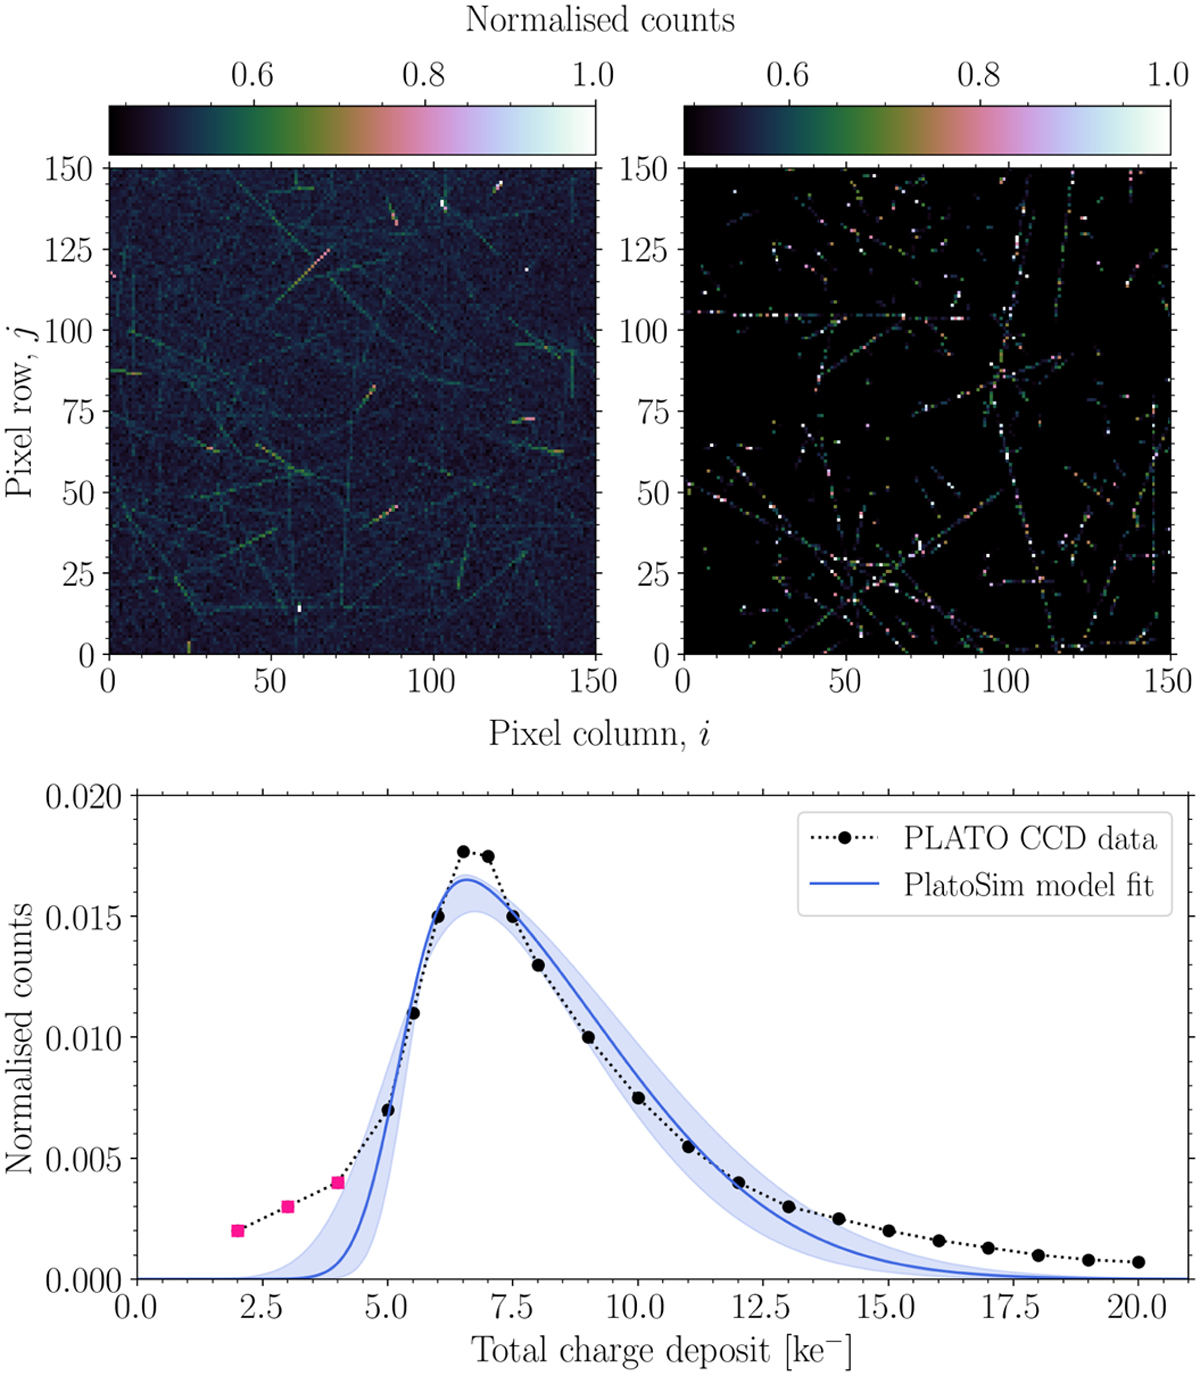
CR model comparison. Top panels: A visual comparison between PlatoSim (left) and CosmiX (right), shown for a small 1502 pixel sub-field. The images are generated using a cycle time of 25 s, a CR hit rate of 100 events s−1 cm−2 (corresponding to solar maximum), and a CR trail length for PlatoSim of up to 300 pixel. As input for CosmiX, we used a unidirectional 55 MeV proton beam and a 40 µm Si pixel volume. Bottom panel: Number distribution of total charge deposit per event. The black dots show the measurements from the proton irradiation test campaign on a PLATO flight model CCD at 203 K (Prod’homme et al. 2018). The blue solid line is a best fit model of PlatoSim’s skew-normal distribution to the test data and the blue shaded region is the 2σ confidence interval. The first three data points (pink squares) were excluded in the fit as they originates from secondary δ-electrons from the setup. The best fit parameters (ψCR,ωCR,αCR) = (5232 ± 76, 3842 ± 197, 6 ± 1) were used to produce the PlatoSim simulation above.
Current usage metrics show cumulative count of Article Views (full-text article views including HTML views, PDF and ePub downloads, according to the available data) and Abstracts Views on Vision4Press platform.
Data correspond to usage on the plateform after 2015. The current usage metrics is available 48-96 hours after online publication and is updated daily on week days.
Initial download of the metrics may take a while.