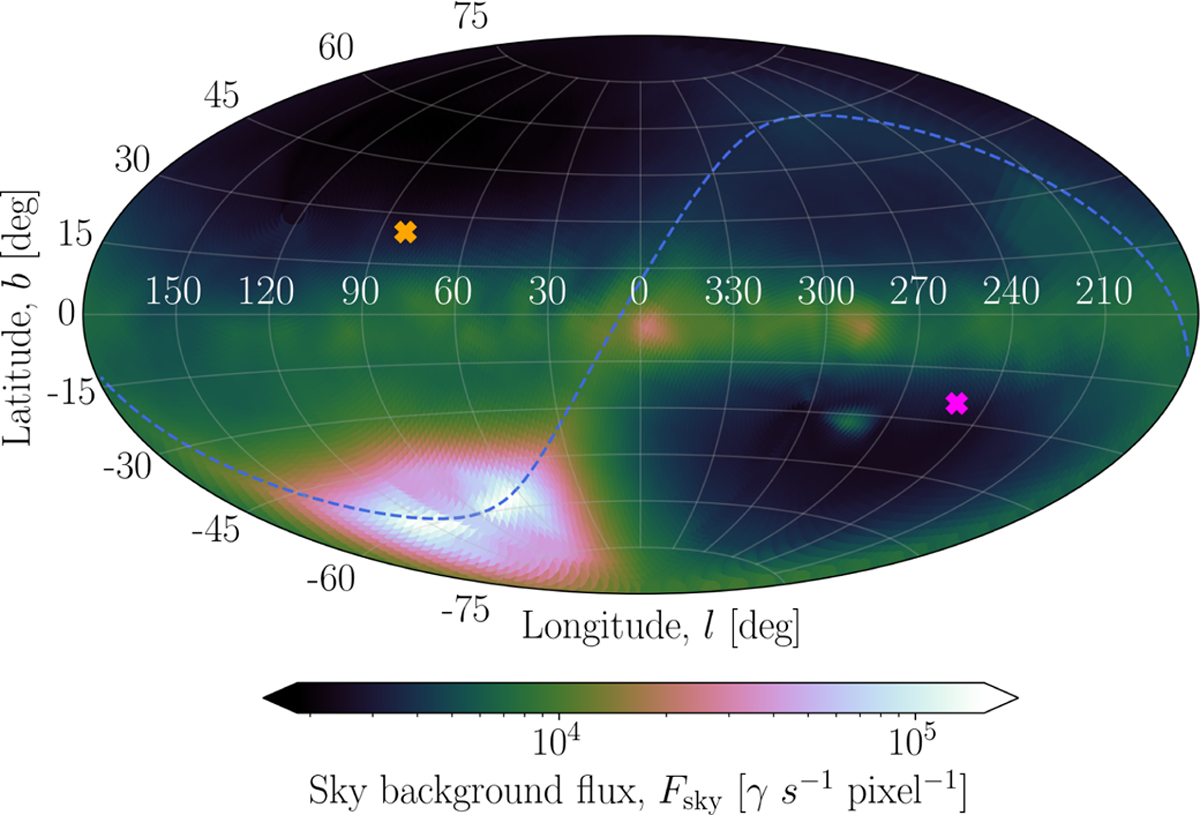
Fig. 6
Download original image
Aitoff projection in Galactic coordinates (l, b) of the all-sky background model used by PlatoSim. The model includes zodiacal light and diffuse galactic light in units of incoming photons per second per pixel. The blue dashed line shows the ecliptic plane (with the location of the Sun clearly visible as the highest intensity area) and with the crosses illustrating respectively the LOP north (orange) and LOP south (magenta) from Nascimbeni et al. (2022). We note that data gaps in the zodiacal map of Leinert et al. (1998) and in the galactic Pioneer 10 map have been interpolated using a cubic spline.
Current usage metrics show cumulative count of Article Views (full-text article views including HTML views, PDF and ePub downloads, according to the available data) and Abstracts Views on Vision4Press platform.
Data correspond to usage on the plateform after 2015. The current usage metrics is available 48-96 hours after online publication and is updated daily on week days.
Initial download of the metrics may take a while.